Figures & data
Figure 1. Results of ZIKV and DENV1 VLP IgG ELISA. Convalescent- and post-convalescent-phase serum or plasma samples from different panels were tested with ZIKV (A,C,E) and DENV1 (B,D,F) VLP IgG ELISA. (A,B) WT-VLP, (C,D) FL/BCL- or FL-VLP, (E,F) rOD ratio of mutant to WT VLP. Data are the means of two experiments (each in duplicate). Dashed lines indicate cutoff rOD and dotted lines cutoff rOD ratio in panels E and F.
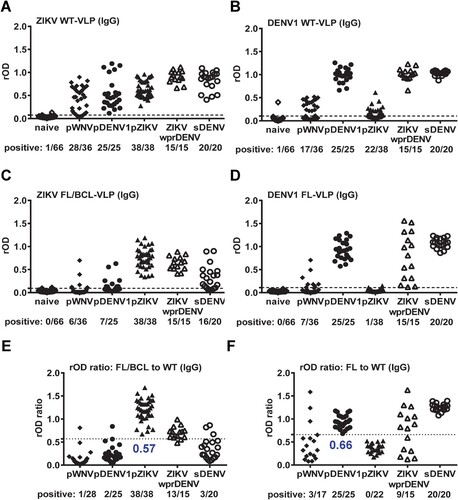
Figure 2. Results of ZIKV and DENV1 VLP IgM ELISA. Convalescent-phase samples from different panels were tested with ZIKV (A,C,E) and DENV1 (B,D,F) VLP IgM ELISA. (A,B) WT-VLP, (C,D) FL/BCL- or FL-VLP, (E,F) rOD ratio of mutant to WT VLP. Data are the means of two experiments (each in duplicate). Dashed lines indicate cutoff rOD and dotted lines cutoff rOD ratio in panels E and F.
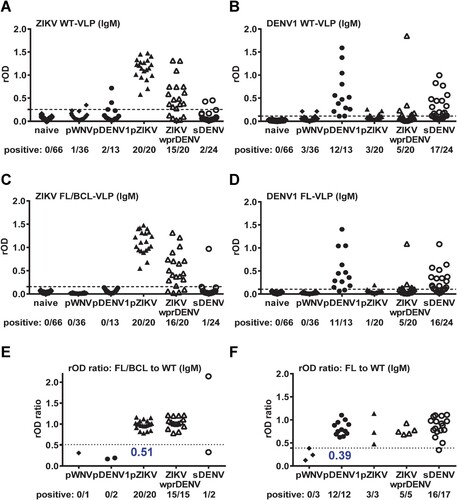
Figure 3. Results of WNV VLP IgG and IgM ELISA. Convalescent- and post-convalescent-phase samples from different panels were tested with WNV VLP IgG ELISA (A,C,E), and convalescent-phase samples with WNV VLP IgM ELISA (B,D,F). (A,B) WT-VLP, (C,D) FL-VLP, and (E,F) rOD ratio of mutant to WT VLP. Data are the means of two experiments (each in duplicate). Dashed lines indicate cutoff rOD and dotted lines cutoff rOD ratio in panels E and F.
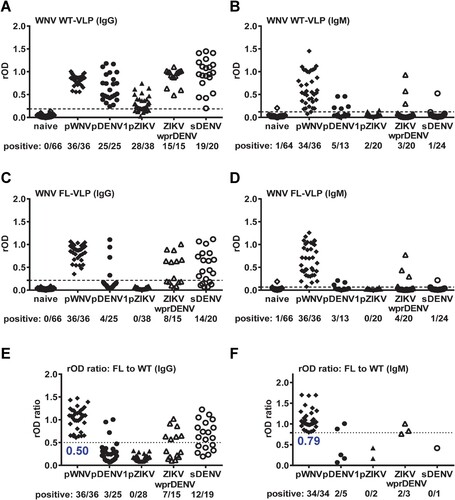
Table 1. Sensitivity and specificity of different VLP-IgG ELISA.
Table 2. Sensitivity and specificity of different VLP-IgM ELISA.
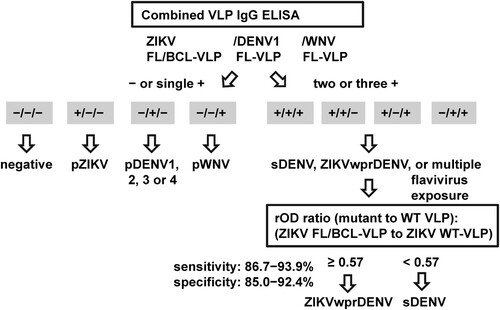
Figure 4. Proposed algorithm of combined VLP IgG ELISA to distinguish three flavivirus infections. Based on the positivity to FL or FL/BCL mutant VLP of three flaviviruses (ZIKV, DENV and WNV), the samples that were negative to all three or positive to one of the mutant VLP could be flavivirus naïve or primary DENV, pZIKV or pWNV infection. For samples that were positive to two or more mutant VLP, the rOD ratio of ZIKV mutant to WT VLP will be calculated to distinguish sDENV and ZIKVwprDENV infections.