Figures & data
Table 1. Nucleotide sequences of PCR primers and a Taqman probe for detecting MKPV.
Figure 1. IBN in the kidneys of B6.Il2rRag2W mice. (A) Representative H&E section of a kidney (400×; inset 20×) from an MKPV-negative mouse. (B) Longitudinal section of kidney from case 1 with chronic IBN and mild hydronephrosis (inset 20×) and mild multifocal neutrophilic pyelonephritis. The kidney has an undulating irregular renal cortex, containing multifocal to coalescing areas of interstitial fibrosis, tubular loss, and tubular degeneration with single cell necrosis, karyomegaly, and intranuclear amphophilic to eosinophilic inclusions (arrowheads: 400×). (C) Longitudinal section of kidney from case 2 with IBN and mild neutrophilic pyelonephritis. Affected convoluted tubules in the renal cortex had vacuolated and degenerated epithelial cells with karyomegalic nuclei and large (∼5–6 µm) amphophilic intranuclear inclusions or small (∼1 µm) densely eosinophilic intranuclear inclusions (arrowheads: 400×). (D) Longitudinal section of kidney from case 3 with moderate to severe IBN (inset 20×). High magnification of the kidney from case 3 exhibited areas of interstitial fibrosis and tubular degeneration with karyomegalic nuclei, chromatin margination and intranuclear inclusions (arrowheads: 400×). (E) MKPV in situ hybridization signals (RNAscope) in renal tubules of case 3 (inset 40×). MKPV nucleic acids were detected (fast red staining) in the nucleus and cytoplasm of affected tubular epithelial cells (400×). (F) Masson trichrome staining of an affected kidney (case 1) showed marked collagen deposition (blue staining) in the renal interstitium (400×; inset 20×).
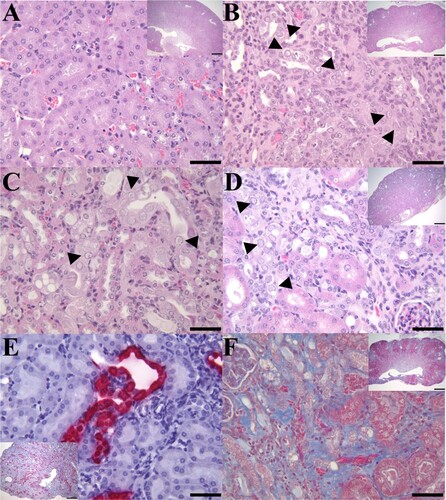
Figure 2. Gene organization of MKPV MIT-WI1. The 4440 nt genome of MIT-WI1 with 5′ and 3′ ITRs contains ORFs which are predicted to encode NS1 (viral replicase), VP1 (capsid protein), accessory proteins p10, p15 and NP-L/I embodied in NS1. NS-2 is formed via alternative slicing which joins the N-terminal ORF (NS-2n in green) and the partial aa sequence of NP-L/I (in green) [Citation5]. This gene organization is conserved among known MKPV/MuCPV strains [Citation10]. There is a dinucleotide deletion at nucleotide 495 in the MIT-WI1 as well as MKPV MSKCC and MuCPV NYC compared with MKPV CI [Citation10].
![Figure 2. Gene organization of MKPV MIT-WI1. The 4440 nt genome of MIT-WI1 with 5′ and 3′ ITRs contains ORFs which are predicted to encode NS1 (viral replicase), VP1 (capsid protein), accessory proteins p10, p15 and NP-L/I embodied in NS1. NS-2 is formed via alternative slicing which joins the N-terminal ORF (NS-2n in green) and the partial aa sequence of NP-L/I (in green) [Citation5]. This gene organization is conserved among known MKPV/MuCPV strains [Citation10]. There is a dinucleotide deletion at nucleotide 495 in the MIT-WI1 as well as MKPV MSKCC and MuCPV NYC compared with MKPV CI [Citation10].](/cms/asset/b639ef1e-0b9f-4566-a9f3-e1777cfa782e/temi_a_1798288_f0002_oc.jpg)
Table 2. Nucleotide sequence similarities between MIT-WI1 and known MKPV/MuCPV genomes.
Table 3. Amino acid sequences (aa) similarities of the corresponing proteins between MIT-WI1 and other known MKPV/MuCPV.
Figure 3. Development of PCR assays for detection of MKPV/MuPCV. A, NS1 regions of 331 nt among known MKPV/MuCPV strains were aligned with the DNASTAR Lasergene 13 package. The nucleotide sequences of conserved PCR primers and qPCR primers/probe were identified. Letters in red represent degenerate nucleotides distinct from the conserved ones. Number in parenthesis corresponds to the genomic position of MKPV CI. B, Validation of the MKPV qPCR assay. Values of the linear regression R2 and interception demonstrates optimal amplification efficiency for the assay; its detection limit is ≤ 10 copies.
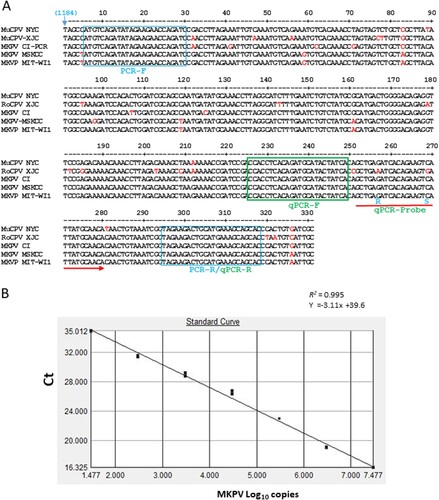
Table 4. MKPV status in selected mouse strains at MIT-WI animal facilities.
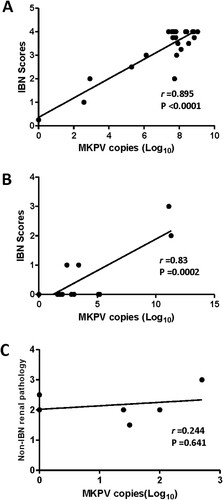
Figure 4. Abundance of MKPV in kidney of immunodeficient mouse strains was significantly correlated with severity of IBN. (A) B6.Il2rRag2W, (B) NSG and (C) UTXflox. Abundance of renal MKPV in mice was significantly correlated with severity of IBN in immunocompromised mice (A) and (B), but not with non-IBN renal pathology in immunocompetent mice (C). Pearson correlation was performed with a two-tailed test.