Figures & data
Figure 1. Identification of phylogenetic groups with reduced ceftriaxone resistance. (A) Phylogeny of isolates shown as Neighborhood-Joining tree based on the 1701 locus cgMLST scheme for the model population used for the antibiotic susceptibility testing. Starting from the centre, the rings represent the serogroups and the antibiotics tested (CRO, DAP, CIP, RAM, TET, LNZ, VAN, GEN, MEP, SXT, AMP, PEN, ERY, TGC). The colour code for the antibiotics represent resistant (red), intermediate susceptible (yellow) and susceptible (blue) strains for the individual antibiotics. The two outer rings show MIC values determined for CRO from 4 mg/L (green) to >128 mg/L (red), as well as the positions of the isolates belonging to the STs further investigated. Data was visualized using iTOL v4 [Citation41]. (B) Ceftriaxone resistance levels among 544 selected L. monocytogenes isolates according to MLST STs. Only STs for which MICs of ≥4 isolates were available were considered in this analysis.
![Figure 1. Identification of phylogenetic groups with reduced ceftriaxone resistance. (A) Phylogeny of isolates shown as Neighborhood-Joining tree based on the 1701 locus cgMLST scheme for the model population used for the antibiotic susceptibility testing. Starting from the centre, the rings represent the serogroups and the antibiotics tested (CRO, DAP, CIP, RAM, TET, LNZ, VAN, GEN, MEP, SXT, AMP, PEN, ERY, TGC). The colour code for the antibiotics represent resistant (red), intermediate susceptible (yellow) and susceptible (blue) strains for the individual antibiotics. The two outer rings show MIC values determined for CRO from 4 mg/L (green) to >128 mg/L (red), as well as the positions of the isolates belonging to the STs further investigated. Data was visualized using iTOL v4 [Citation41]. (B) Ceftriaxone resistance levels among 544 selected L. monocytogenes isolates according to MLST STs. Only STs for which MICs of ≥4 isolates were available were considered in this analysis.](/cms/asset/291fbb8f-f7e0-4729-8247-7548d5524b11/temi_a_1799722_f0001_oc.jpg)
Table 1. Antibiotic resistance profiles of the L. monocytogenes model population.
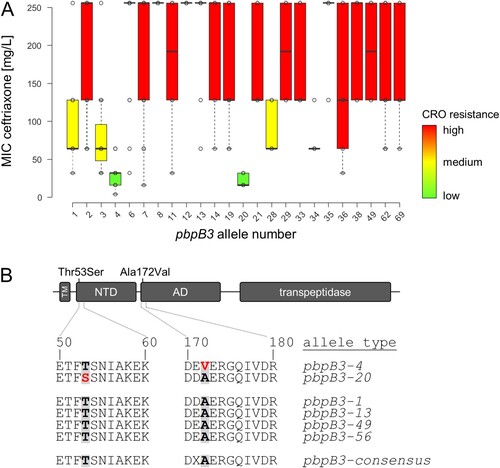
Figure 2. Identification of pbpB3 alleles associated with reduced ceftriaxone resistance. (A) Ceftriaxone resistance levels among 544 selected L. monocytogenes isolates according to their pbpB3 allele in the Ruppitsch cgMLST scheme. Only those pbpB3 alleles for which MICs of ≥4 isolates were available were considered in this analysis. (B) Scheme illustrating PBP B3 domains and position of the amino acid exchanges found in the pbpB3 alleles no. 4 (Ala172Val) and 20 (Thr53Ser), which are associated with reduced ceftriaxone resistance. Abbreviations: TM – transmembrane helix, NTD – N-terminal domain; AD – allosteric domain.