Figures & data
Figure 1. Phylogenetic analysis of the IBV HA and NA genes. The unrooted trees were constructed using the neighbour-joining method with the maximum composite likelihood model and MEGA version 7 with 1000 bootstrap replicates. (A–B) Complete HA (A) or NA (B) gene nucleotide sequences of IBV isolated during 2014–2018 from human in mainland China were download from GISAID. The red lines indicate viruses from the 2017/2018 year, the blue lines indicate viruses belonged to pre-2017/2018 year, and the green points indicate the viruses used in the present research.
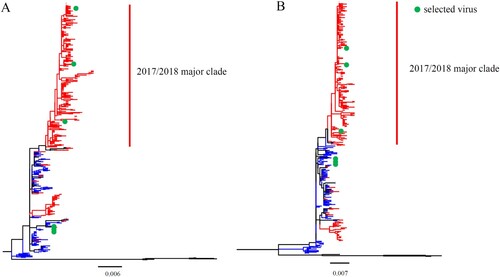
Figure 2. In vitro and in vivo characterizations of IBV. (A) Growth kinetics of different IBVs in MDCK cells at 37°C. MDCK cells were infected with AH1528/14, AH127/15, SC52/17, NMG11/18, SH1101/17, or SH1485/15 at an MOI of 0.001. The supernatant of the infected cells was harvested at the indicated times. The viral titres were determined as the TCID50 in MDCK cells. The presented results are the means of three independent experiments, and the error bars show the standard errors of the mean (SEM). (B–C) Bodyweight loss (B) and survival rate (C) of mice infected with various IBV strains. Groups of mice (n = 5) were intranasally infected with 107 TCID50 of each virus or PBS. The bodyweight loss and the survival of the animals were monitored through 14 d.p.i.
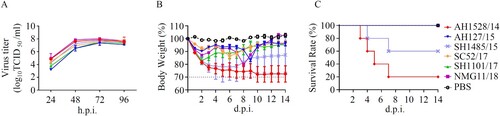
Figure 3. Infectivity, virulence, and replication of AH1528/14 and AH127/15 in mice. (A–B) Five mice per group were inoculated intranasally with PBS (control) or with 101–107 TCID50 of AH127/15 (A) or AH1528/14 (B). Bodyweight changes and survival of the mice were monitored daily. (C)Mice were infected with 107 TCID50 of wildtype AH127/15 or AH1528/14, 1 and 4 days later three mice per group were euthanized. The viral titres in tissues were determined by performing TCID50 assays. (D) The histopathological lesions in the lungs of mice infected with PBS (a), AH127/15 (b) or AH1528/14 (c). Scale bars, 100 µm. (E) The mRNA levels of cytokines and chemokines in the lungs were determined by performing real-time PCR. Error bars for body weight show the standard errors of the mean (SEM). The statistical significance compared with AH127/15-infected mice was determined by a t-test, *indicates p < 0.05.
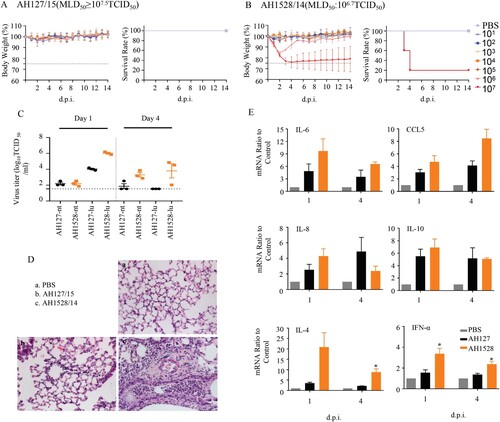
Table 1. MLD50 and MID50 of the wild type and recombinant viruses.
Figure 4. In vitro growth kinetics of the recombinant IBVs. (A–G) MDCK cells were infected with rAH127, rAH127/NAN342D (A), rAH127/PB1V212I (B), rAH127/HAA390E (C), rAH127/NAN342D+PB1V212I (D), rAH127/HAA390E+NAN342D (E), rAH127/HAA390E+PB1V212I (F), or rAH127/HAA390E+NAN342D+PB1V212I (G) at an MOI of 0.001. Culture supernatants were harvested at 0, 12, 24, 36, 48, and 60 h.p.i. and the titres were determined by performing TCID50 assays in MDCK cells. The presented results are the means of three independent experiments, and the error bars show the standard errors of the mean (SEM).
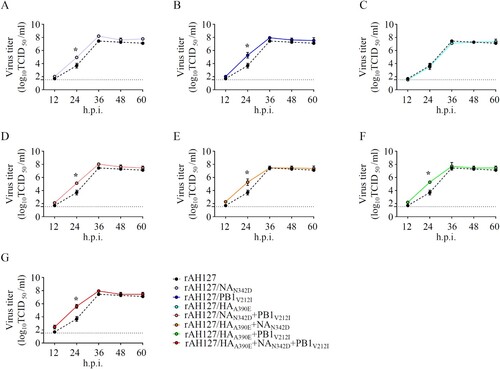
Table 2. Amino acid substitutions between AH1528/14 and AH127/15
Figure 5. Virulence of the recombinant IBVs in vivo. (A–H) Five mice per group were inoculated intranasally with 101 to 107 TCID50 of rAH127 (A), rAH127/NAN342D (B), rAH127/PB1V212I (C), rAH127/NAN342D+PB1V212I (D), rAH127/HAA390E (E), rAH127/HAA390E+NAN342D (F), rAH127/HAA390E+PB1V212I (G), or rAH127/HAA390E+NAN342D+PB1V212I (H). Body weight changes (left panels) and survival (right panels) of the mice were monitored daily. The error bars for body weight show the standard errors of the mean (SEM).
Figure 6. Viral replication and pathological changes in mice infected with the recombinant IBVs. Mice were infected with 107 TCID50 of the recombinant IBVs. Three mice from each group were euthanized at 1 and 4 dpi. (A)The viral titres in mouse lungs were determined by performing TCID50 assays. (B) The mRNA levels of cytokines and chemokines in lung were determined by performing real-time PCR. (C) The histopathological lesions in the lungs, Scale bars, 100 µm. Statistical significance compared with mice infected with the rAH127 virus was determined by a t-test, *indicates p < 0.05, ** indicates p < 0.01.
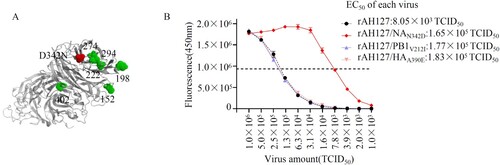
Figure 7. NAN342D enhances IBV neuraminidase activity. (A) Known locations in or near the IBV neuraminidase active sites are highlighted in the modelled protein structure of the IBV NA. The N342D substitution is shown in red, previously described mutations are shown in green. (B) The NA activities of these viruses were detected in the presence of 200 µM MUNANA. The reactions were analysed at excitation and emission wavelengths of 365 nm and 450 nm, respectively. The dashed line shows the half-maximal effective concentration (EC50).