Figures & data
Table 1. Bacteria species used in this study.
Table 2. Survival (%) of Artemia franciscana at different time points after being challenged with V. harveyi wild type and its quorum sensing mutants (mean ± SD, n = 12).
Table 3. Average (±SD) cell counts and dead cells percentage of V. harveyi wild type BB120 and its derivatives with or without PirABVP (PirAB+ or PirAB-), obtained from flow cytometer (n = 3).
Table 4. The effect of PirABVP on virulence factors of V. harveyi wild type BB120 and its derivatives (n = 3).
Figure 1. Survival (%) of Artemia franciscana at different time points after being challenged with PirABVP toxin @ 5.2 µg/100 µl and Vibrio harveyi strains (A) PirABVP toxin and V. harveyi wild type BB120 strain, (B) PirABVP toxin and HAI-1 deficient mutant BB152 strain, (C) PirABVP toxin and CAI-1 deficient mutant JMH603 strain, (D) PirABVP toxin and AI-2 deficient mutant MM30 strain and (E) PirABVP toxin and QS triple mutant JMH634 strain. The error bars represent the standard deviation values of 12 replicates. Asterisks on the top of error bars indicate the significant in vivo interaction, either synergistic or antagonistic interaction between toxin and bacteria, and based on output interaction plot obtained from two-way ANOVA analysis *(p < 0.05), **(p < 0.01), ***(p < 0.001). The effect of the toxin or the Vibrio is not statistically analysed and hence not presented here, only the interactive compound of the 2-way ANOVA is presented. For an interactive statistical effect to be considered of biological relevance, only data at timepoints for which the survival in all treatments was above 10% are considered.
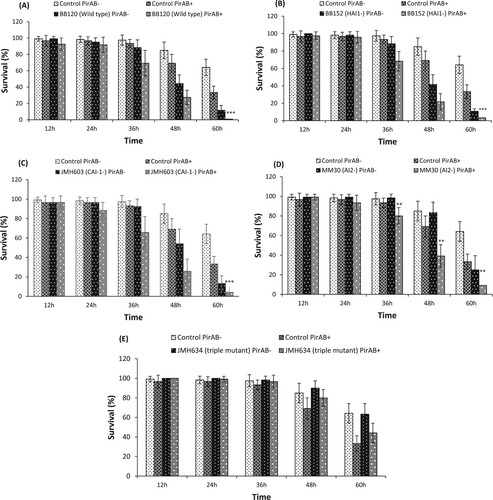
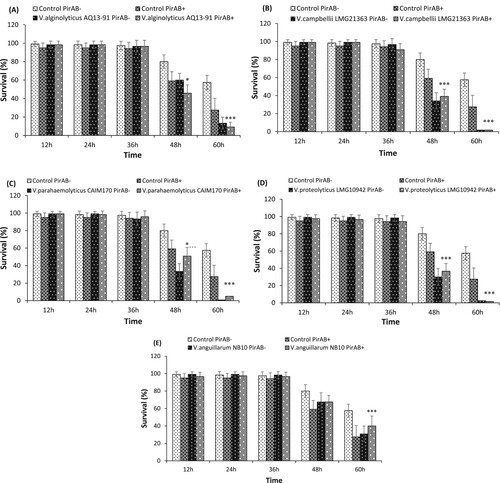
Figure 2. Survival (%) of A. franciscana at different time points after being challenged with PirABVP toxin @ 5.2 µg/100 µl and (A) V. alginolyticus AQ13-91, (B) V. campbellii LMG21363 (C) V. parahaemolyticus CAIM170, (D) V. proteolyticus LMG10942 and (E) V. anguillarum NB10. The error bars represent the standard deviation values of 12 replicates. Asterisks on the top of error bars indicate the significant in vivo interaction, either synergistic or antagonistic interaction between toxin and bacteria, and based on output interaction plot obtained from two-way ANOVA analysis *(p < 0.05), **(p < 0.01), ***(p < 0.001). The effect of the toxin or the Vibrio is not statistically analysed and hence not presented here, only the interactive compound of the 2-way ANOVA is presented. For an interactive statistical effect to be considered of biological relevance, only data at timepoints for which the survival in all treatments was above 10% are considered.