Figures & data
Figure 1. Macrophages infected with B. cenocepacia increased the expression of MHC and CD86 molecules. Resting macrophages or macrophages pre-treated with 300 U/ml of IFNγ or with 10 ng/ml of LPS from C57Bl/6 mice were infected with B. cenocepacia (MH1 K) at a MOI of 50 for 1 h. Cells were washed, incubated for 24 h and processed for flow cytometry analysis. Cell populations were analyzed by the fluorescence intensity of class I MHC (A), class II MHC (B), CD80 (C) and CD86 (D) molecules. Blue bars indicate expression in non-infected macrophages and the orange bars the level of expression in infected (MH1 K) macrophages. The results were obtained from 3 independent experiments, each one in duplicate (n = 6), and plotted as the mean fluorescence intensity ± SD and analyzed by the paired t-test. NI, non-infected; a.u., arbitrary units; *, p<0.05; ns, non-significant.
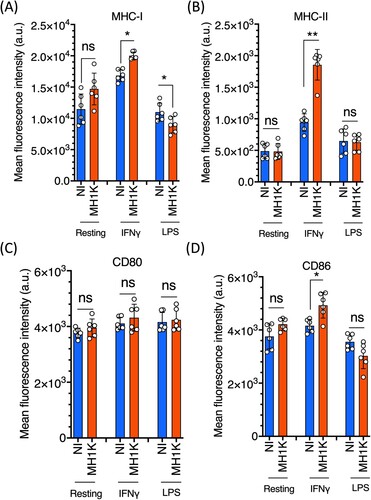
Figure 2. IFNγ-treated macrophages control intracellular B. cenocepacia. Three x 105 macrophages from C57Bl/6 mice were pre-treated with 300 U/ml of IFNγ and infected with B. cenocepacia at a MOI of 50. (A) Non-treated macrophages (purple bars) or pre-treated macrophages with IFNγ (green bars) were infected with B. cenocepacia MH1 K by 1 h, the cells were washed and lysed at 1 or 24 h post-infection to quantify the number of bacterial CFUs per well. (B) Non treated (BMDM) or pre-treated macrophages with IFNγ (BMDM + IFNγ) were incubated with 1μg/ml of zymosan particles conjugated to AF488 during 15 min. Cells were analyzed by immunofluorescence microscopy. Bars indicates 10 μm. One representative image of 15 is presented. (C) Cells were analyzed by flow cytometry. Non-treated macrophages (purple bar) or pre-treated macrophages with IFNγ (green bar), one representative experiment of three replicates (n=6) is presented. 20000 events were analyzed by each experiment. (D) Culture supernatants were used to quantify macrophage cell death (cytotoxicity) by the assaying released lactate dehydrogenase activity at 24 h post-infection. Released TNFα (E) and IL-1β (F) at 24 h post-infection were detected by ELISA on macrophages non-infected (NI) or infected with B. cenocepacia (MH1 K). Green bars (D, E and F) indicate IFNγ-treated macrophages and the purple bars indicate resting macrophages. The results were obtained from 3 independent experiments, each one in triplicate (n = 9), plotted as mean ± SD and analyzed by the paired test. **p<0.01; ****p<0.0001; ns, non-significant.
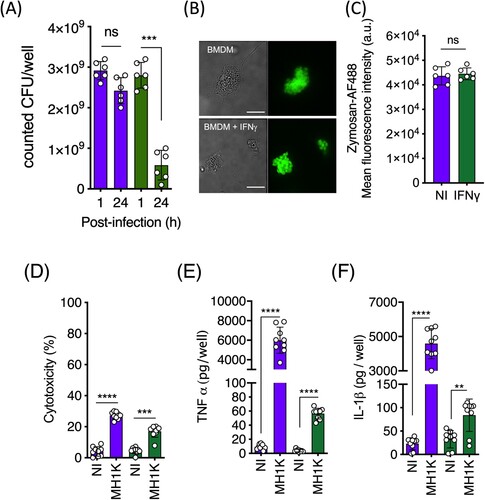
Figure 3. Intracellular B. cenocepacia is localized in the MHC class II compartment. IFNγ-treated (300 U/ml) macrophages from C57Bl/6 mice were incubated with B. cenocepacia (pDSRedT3) at a MOI of 50 during 1 h. At 3 h post-infection, infected macrophages were stained with anti-Rab7 (A), anti-LAMP1 (B) or anti-class II MHC (C). Images of infected macrophages were analyzed by immunofluorescence. Bars indicates 10 μm. For Rab7 we analyzed 202 BcCV in 141 cells; for LAMP1, 192 BcCV in 128 cells and for MHC class II, 181 BcCV in 132 cells. The co-occurrence of green and red pixels was determined by Pearson’s correlation coefficient (PCC).
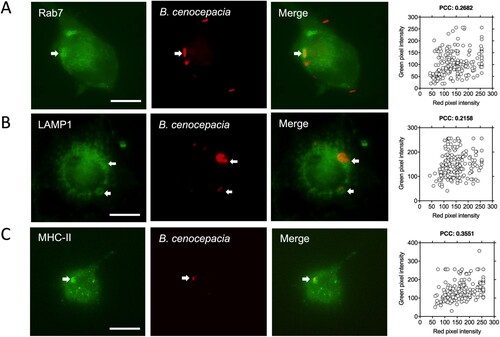
Figure 4. The BcCV is a non-acidic compartment. IFNγ-treated (300 U/ml) macrophages from C57Bl/6 mice were infected with B. cenocepacia (pDSRedT3) at a MOI of 50 during 1 h. At 3 h post-infection, infected macrophages were incubated with LysoTracker Green 1 μM (A). Images of infected macrophages were analyzed by immunofluorescence. Bars indicates 10 μm. The co-occurrence of green and red pixels was determined by Pearson’s correlation coefficient (PCC). (B) Sucrose gradient purification of vacuoles from IC-21-like peritoneal macrophages from C57Bl/6 mice infected with B. cenocepacia. The CFUs (Black dots) and β-galactosidase activity (Red dots) were quantified from each gradient fraction. The expression of LAMP1 was determined by western blot. The average of two biological repeats are presented. Bottom correspond to the gradient fractions with high density and the Top to the gradient fractions with low density.
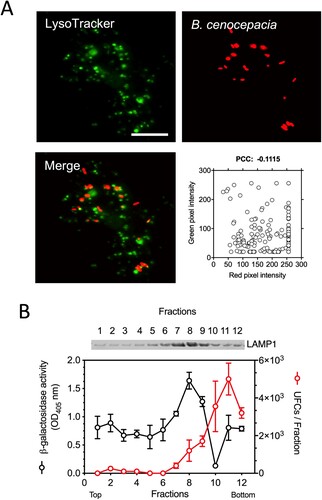
Figure 5. Macrophages infected with B. cenocepacia present bacterial antigens to CD4+ T-cells. Macrophages from C3H/HeJ mice were pre-treated with 300 U/ml of IFNγ prior to infection with B. cenocepacia-pzmpA-HEL (MH1K-HEL) at MOI of 50 during 1 h. Infected macrophages were co-cultured with C-10 cells, a CD4+ T-cell hybridoma during 24 h. Gray bar indicates the response of the C-10 hybridoma with non-infected cells (NI). Green bar indicates macrophages infected with MH1K-HEL, red bar indicates macrophages infected with heat-killed MH1K-HEL (MH1K-HEL-HK). Blue bar indicates the response of C-10 against macrophages pulsed with 250 μg/ml of HEL. The graph represents the results of 3 independent experiments in triplicate (n = 9), plotted as mean ±SD and analyzed by the paired t-test. **, p=0.0038; ns, non-significant.
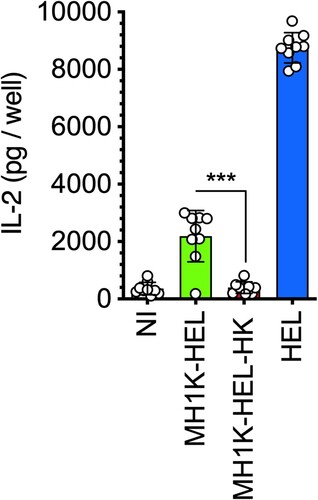
Figure 6. Macrophages infected with B. cenocepacia present bacterial antigens to CD8+ T-cells. Macrophages from C57Bl/6 mice were pre-treated with 300 U/ml of IFNγ and infected with B. cenocepacia-pzmpA-OVA (MH1K-OVA) or heat-killed (MH1K-OVA-HK) at MOI of 50 during 1 h. (A) Quantification of class I MHC H-2Kb/peptide complexes at 24 h post-infection. (B) Quantification of class I MHC molecules H-2Kb/pOVA257-264 complexes at 24 h post-infection. (C) Infected macrophages were co-cultured with the RF33.70, a CD8+ T-cell hybridoma for 24 h. White bar indicates isotype antibody (A). Gray bars indicates non-infected cells (NI) (A, B), and response of RF33.70 hybridoma with non-infected cells (C). Green bars indicate macrophages infected with MH1K-OVA, red bars indicates macrophages infected with MH1K-OVA heat-killed (MH1K-OVA-HK). Blue bar indicates macrophages pulsed with100 ng/ml pOVA257-264 (B) and the response of RF33.70 hybridoma against macrophages pulsed with 100 ng/ml of pOVA257-264 (C). The results presented in panel A and B were obtained from 4 independent experiments, each one in duplicate (n = 8), and the result presented in panel C was obtained from 3 independent experiments, each one in triplicated (n = 9) and analyzed by one-way ANOVA with the Turkey multiple comparison test. The bars were plotted as mean ± SD. *, p<0.05; ns, non-significant.
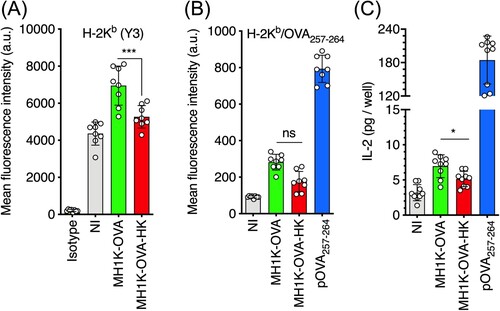
Figure 7. Macrophages infected with B. cenocepacia release products of bacterial processing into the extracellular media. Macrophages from C3H/HeJ mice (H-2Kk) were pre-treated with 300 U/ml of IFNγ and infected with B. cenocepacia (MH1 K) at a MOI of 50 during 1 h. (A) Infected macrophages were co-cultured with RMA-S (H-2Kb) cells at a 1:2 ratio during 24 h. (B) Class I MHC H-2Kb/peptide complexes were quantified by flow cytometry with Y3 (anti-H-2Kb/peptide) monoclonal antibody. White bar indicates isotype antibody (B). Gray bar indicates the quantification of class I MHC/peptides on RMA-S cells cocultured with non-infected macrophages (NI), green bars, RMA-S cells co-cultured with macrophages infected with live (MH1 K) and red bars, RMA-S cells co-cultured with macrophages infected with heat killed (MH1K-HK) bacteria. The results were obtained from 3 independent experiments, each one in triplicate (n = 9), plotted as the mean of fluorescence intensity ± SD, and analyzed by one-way ANOVA with the Turkey multiple comparison test. *, p=0.0187.
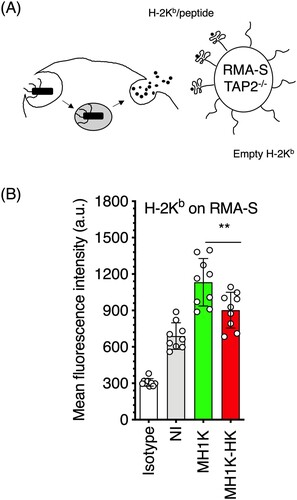
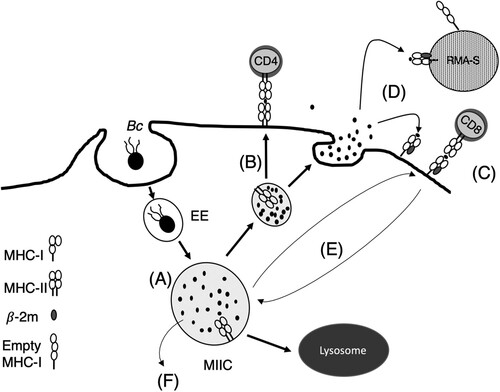
Figure 8. Model of antigen processing and presentation of B. cenocepacia by class I and class II MHC molecules to T-cells. (A) MIIC in which live B. cenocepacia is processed. (B) Bacterial antigens are recognized by CD4+ T-cells or (C) CD8+ T-cells. (D) Products of bacterial processing are released to the extracellular media. (E) Recycling of class I MHC from plasma membrane to the MIIC. (F) Translocation of bacterial antigens from the MIIC to the cytosol.