Figures & data
Figure 1. The levels of SARS-CoV-2 titer in human epithelial cell lines corresponding to viral infection sites. (A) Schematic diagram of human epithelial cell lines corresponding to major infection sites of SARS-CoV-2. (B) The indicated cells were grown on a 48-well plate and infected with 5 MOI of SARS-CoV-2. Viral RNA levels were determined in the media collected at the indicated time points. Data are presented as mean values with error bars showing the standard deviations from three independent experiments. ND, not detected.
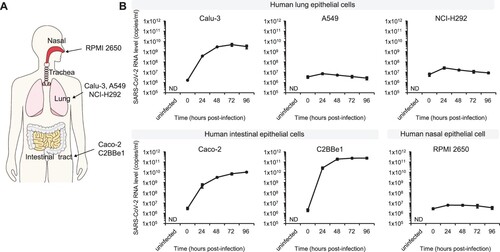
Table 1. Various cell lines tested for permissiveness to SARS-CoV-2 infection.
Figure 2. TMPRSS2 exploits ACE2-mediated SARS-CoV-2 dissemination. (A, B) The levels of SARS-CoV-2 titer and viral receptor expression were compared in various human epithelial cell lines. Viral RNA levels were plotted against relative mRNA levels of ACE2 (A) or TMPRSS2 (B). Relative ACE2 or TMPRSS2 mRNA levels represent the fold changes in the indicated mRNA level of each cell compared to A549 cells. Pearson coefficients (r) and p-values (p) were calculated as described in the materials and methods section. (C) ACE2 and TMPRSS2 were ectopically expressed in RPMI 2650 cells by transient transfection of ACE2 or TMPRSS2 expressing plasmids. After 24 h, the cells were infected with 1 MOI of SARS-CoV-2. Viral RNA levels in the media collected at 48 dpi were determined. ND, not detected.
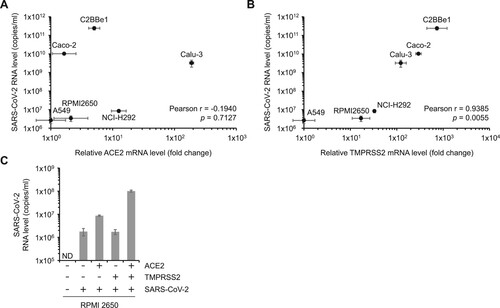
Figure 3. Dramatic induction in ACE2 and DPP4 expression by cellular differentiation. (A) Schematic diagram of the structure of enterocytes. (B-F) C2BBe1 cells were differentiated on trans-well filters. The undifferentiated cells were seeded on a day before harvesting. The mRNA levels of the indicated genes normalized to GAPDH in the undifferentiated (Undiff) and differentiated cells (Diff) were compared. SI, sucrose-isomaltase; IAP, intestinal alkaline phosphatase. (G) The protein expression levels of ACE2 and DPP4 were detected in the cell lysates from the undifferentiated and differentiated C2BBe1 cells by Western blotting. The ratio of ACE2 to β-actin was determined by densitometric analysis. (H) The undifferentiated and differentiated C2BBe1 cells were infected with 0.2 MOI of SARS-CoV-2. The viral titer in the media was determined at 2 dpi. ND, not detected.
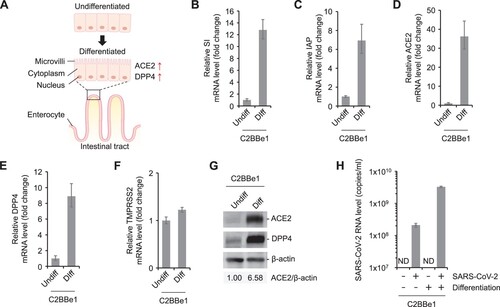
Figure 4. Increased expression of ACE2 receptor in C2BBe1 cells during SARS-CoV-2 infection. (A-C) C2BBe1 cells were infected with 1 MOI of SARS-CoV-2. The mRNA levels of the indicated genes were measured from the cells harvested at 72 hpi. Each mRNA level was normalized to that of GAPDH. (D) ACE2 and SARS-CoV-2 nucleocapsid (N) protein in the C2BBe1 cells with or without viral infection were detected by Western blotting. The ratio of ACE2 to GAPDH was determined by densitometric analysis. (E) The mRNA levels of the indicated interferon genes were measured. Each mRNA level was normalized to that of GAPDH.
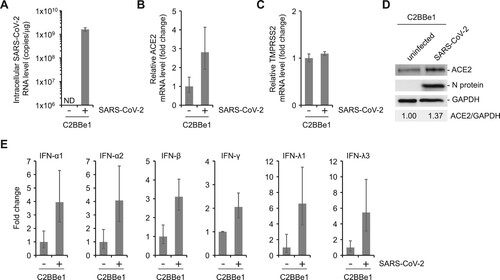
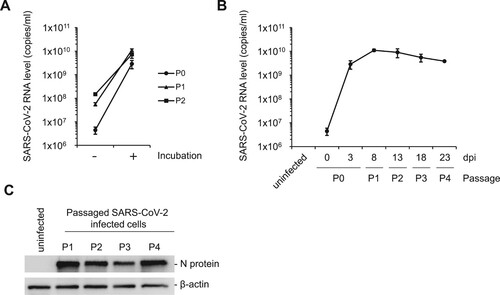
Figure 5. Persistent infection of SARS-CoV-2 in C2BBe1 cells. Initially, 1 MOI of SARS-CoV-2 was infected into C2BBe1 cells (P0). The cells were passaged 4 times (P1-P4) for a total of 23 days. (A) At each indicated passage, fresh media was added and the cells were grown until 70–80% confluency. Media were collected before and after incubation. Viral titers in the collected media were quantified. (B) Viral titers in the media collected at each passaging was determined. (C) SARS-CoV-2 nucleocapsid (N) protein was detected by Western blotting using the total cell lysates from the indicated passage. Data are presented as mean values with error bars showing the standard deviations from three independent experiments.