Figures & data
Figure 1. Vaccine-induced infiltration of CD4+T cells into gastric tissue. Mice were immunized with SF+CCF or Al+CCF by GSL vaccination. Briefly, a laparotomy was done to expose the stomach, and 7 µL of a vaccine formulation was injected into the subserosa layer of the stomach. Incisions in the peritoneum and skin were sutured (SF+CCF, silk fibroin hydrogel-based vaccine; Al+CCF, alum adjuvant-based vaccine; GSL, gastric subserous layer). At 7 days after immunization, mice were sacrificed, and gastric tissue was collected for further testing. (A) Frozen sections of gastric tissue from immunized mice were stained with antibodies against CD4, nuclei are depicted by DAPI staining; scale bar = 100 µm (n=5 mice per group). (B) Counts of CD4 cells in area of the V or RV per 0.25 mm2 were randomly chosen and calculated (green, CD4; blue, DAPI; V, vaccination site; RV, remote area of vaccination site). (B and C) Antigen-specific CD4+T cells in the stomach were counted by staining of intracellular cytokines. Single-cell suspensions from gastric tissue were stimulated with 106 naïve CFSE-labeled splenocytes preloaded with antigen CCF, and then the percentage and number of IFN-γ/IL-17-producing CD4+T cells was calculated. Values are the mean ± SD (n=5 mice per group). Data are representative of two independent experiments. P-values were obtained using the Student’s t-test. *P < 0.05.
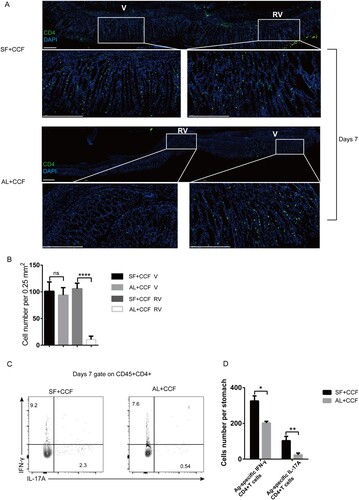
Figure 2. Characterization of gastric intraepithelial CD4+TRM cells. Mice were immunized with SF+CCF by GSL vaccination, as described in . (A and B) At 7, 21, 28, 56 and 168 days after immunization, CD69 expression of gastric intraepithelial CD4+T cells was analysed by flow cytometry. (C) At 28 days after immunization, expression of CD69 and CD103 of CD4+T cells from the gastric epithelium (ST), spleen (SP), blood, and mesenteric lymph nodes (MLNs) was measured. (D and E) At 28 days after immunization, expression of CD62L, CD44, CCR1, CCR3, CCR5, CCR7 and CXCR3 of gastric intraepithelial CD4+T cells was measured. (F and G) CD45.1+ and CD45.2+ mice immunized with SF+CCF 28 days previously underwent parabiotic surgery. At 21 days after parabiosis, the population of total, antigen-specific host, and donor-derived CD4+T cells in the gastric tissues of parabiotic mice was analysed by flow cytometry. Values are the mean ± SD (4–5 pairs). P-values were obtained using the Student’s t-test. Data are representative of two independent experiments. ****P < 0.0001.
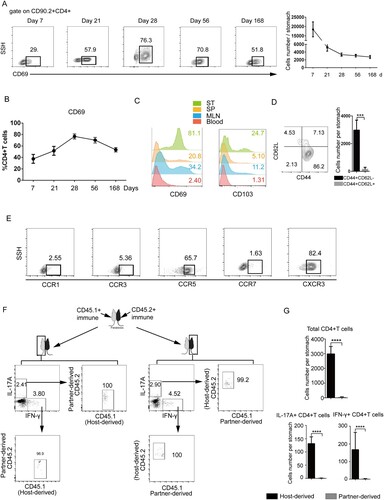
Figure 3. Vaccine-induced TRM cells are superior to circulating T cells for mediating protection against H. felis insult. Mice were immunized with SF+CCF by GSL vaccination, as described in . (A–D) 28 days later, mice were injected (i.p.) with FTY720 (1 mg/mL) or PBS daily for 3 days as indicated in the table. Then, mice were challenged with H. felis. 3 days later, colonization of the stomach by pro-inflammatory neutrophils and monocytes was analysed. (E and F) At 28 days after immunization, mice were injected (i.p.) with anti-Gr-1 antibody or Isotype Rat IgG2b (200 μg) daily for 3 days. Then, mice were challenged with H. felis. 3 days later, colonization of the stomach was analysed. (G and H) According to the table, the indicated CD45.1+ and CD45.2+ mice, naive or immunized with SF+CCF 28 days previously, underwent parabiotic surgery. At 21 days after parabiosis, the indicated partner was challenged with H. felis. 3 days later, colonization of the stomach of indicated mice was detected. Values are the mean ± SD (n = 4–5). Data are representative of two independent experiments. P-values were obtained using ANOVA. *P < 0.05, **P < 0.01, ****P < 0.0001, n.s, not significant.
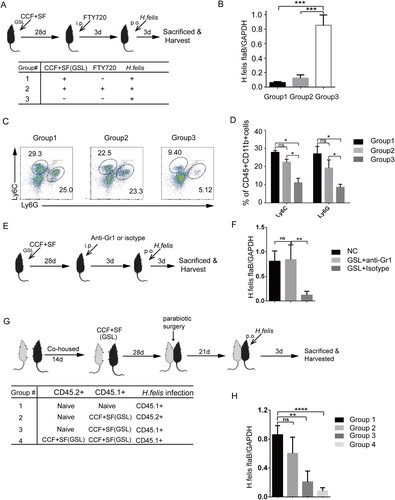
Figure 4. Differentiated EGFP+CD4+TRM cells formed in the gastric epithelium. (A) In vitro-activated EGFP+CD4+T cells were injected into the GSL of wild-type naive mice immunized with SF+CCF by GSL simultaneously. Mice were sacrificed 7 and 28 days after transfer. (B) EGFP+CD4+T cells from the GELs and GRLs of mice were analysed using flow cytometry (GELs, gastric epithelial leukocytes; GRLs, gastric remaining leukocytes). (C) In vitro-activated EGFP+CD4+T cells before being injected into GSLs of wild-type naive mice were treated with pertussis toxin (PTX) or PBS (no PTX). (D) At 7 and 28 days after transfer, expression of EGFP and CD69 in CD4+ cells was analysed. (E) Then, CD69+EGFP+CD4+T cells were quantified. (F) At 7 and 28 days after transfer of EGFP+CD4+T cells, CXCR3 expression in EGFP+CD4+T cells from GELs was measured. (G) At 28 days after transfer, CXCR3 expression of EGFP+CD4+CD69− cells and EGFP+CD4+CD69+ cells from GELs was measured. (H) Then, quantification of CXCR3+CD69+EGFP+CD4+T cells from GELs and GRLs was done. Values are the mean ± SD (n = 5). Data are representative of two or three independent experiments. P-values were obtained using ANOVA. *P < 0.05, **P < 0.01.
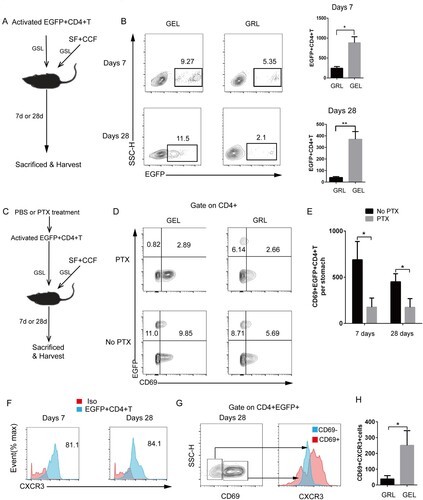
Figure 5. Inflammatory neutrophils and monocytes were associated with the location of gastric intraepithelial CD4+TRM cells. Mice were immunized with CCF+SF or CCF+PBS by GSL vaccination, as described in . Myeloid-lineage cells and lymphocytes were gated according to (A) and (C), respectively. (B and D) These graphs illustrate the total numbers of several immune-cell subsets in the gastric mucosa. (E and F) The proportion of neutrophils and monocyte was counted using flow cytometry. (G) At 3 days after immunization, frozen sections of gastric tissue from immunized mice were stained with antibodies against CD4 (green) and CD11b (red), and nuclei are depicted by DAPI (blue); scale bar = 100 µm. (H) At 3 days after immunization, the total CD11b+ population from the gastric epithelium was analysed. (I, J and K) Mice were treated with anti-Gr1 antibody or Isotype daily. Three days later, mice were immunized with CCF+SF by the GSL. At 28 days after immunization, the population of gastric intraepithelial CD69+CD4+T cells was analysed using flow cytometry (SP, spleen; ST anti-Gr1, the stomach of anti-Gr1-treated mice; ST Isotype (Rat IgG2b), the stomach of Isotype-treated mice). Values are the mean ± SD (n = 5). Data are representative of two independent experiments. P-values were obtained using t-test. ***P < 0.001, n.s, not significant.
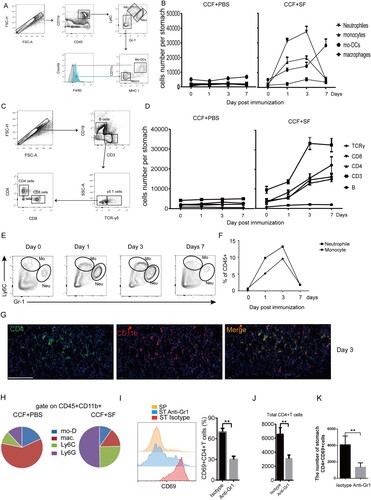
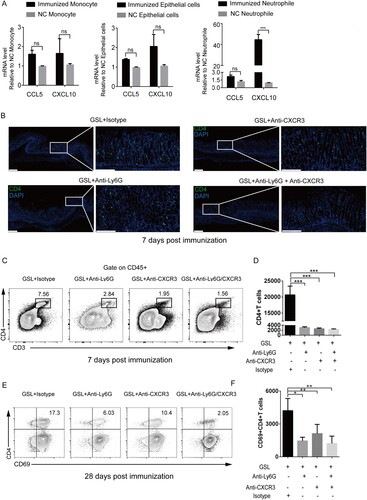
Figure 6. CXCR3 regulated entry into the gastric epithelium and formation of vaccine-induced CD4+TRM cells. (A) Mice were immunized with CCF+SF by GSL vaccination, as described in . The stomach was harvested 3 days after immunization, and the number of neutrophils, monocytes and epithelial cells was sorted using a cell sorter for detecting mRNA expression of CXCL10 and CCL5. The neutrophils and monocytes from the blood of naive mice, and epithelial cells from the stomach of naive mice, were the negative control. (B–F) Mice were treated with anti-Ly6G antibody, anti-CXCR3 antibody or isotype (Armenian Hamster IgG and Rat IgG2a) daily. Three days later, mice were immunized with CCF+SF by the GSL, as described in . (B) At 7 days after immunization, frozen sections of gastric tissue from immunized mice were stained with antibodies against CD4 (green), and nuclei are depicted by DAPI (blue); scale bar = 100 µm. (C and D) At 7 days after immunization, the population of CD4+T cells from within the gastric epithelium of mice was analysed using flow cytometry. (E and F) At 28 days after immunization, the population of CD69+CD4+TRM cells from within the gastric epithelium of mice was analysed using flow cytometry. Values are the mean ± SD (n = 5). Data are representative of two independent experiments. P-values were tested using ANOVA. *P < 0.05, **P < 0.01, ***P < 0.001.