Figures & data
Figure 1. Validation of Ad-hACE2. (A) A549 cells were transduced with Ad-Empty or Ad-hACE2 at an MOI of 100 for 3 h at 37°C. 24 h post-transduction, surface expression of hACE2 was detected by flow cytometry. RFI = relative fluorescence intensity generated by multiplying % hACE2+ cells by the geometric mean fluorescence. (B) A549 cells were transduced with Ad vectors as described in (A) followed by infection 24 h later with SARS-CoV-2 USA-WA1/2020 at an MOI of 0.1. Virus titers were determined by plaque assay on VeroE6 cells. BALB/c mice were administered intranasally (i.n) with the indicated dose of Ad-Empty, Ad-hACE2, or PBS. Lungs were harvested on day 5 post-transduction, paraffin embedded and 5μm sections stained for H&E (C), or for IHC-P using an isotype control (D) or α-hACE2 monoclonal antibody (E). Regions of the lung anatomy are indicated on isotype control sections; AS = alveolar septa, BE = bronchiolar epithelium, E = endothelium. Scale bar is 100 nm, IHC-P staining is indicated by brown staining for DAB substrate. (F) Separate groups of BALB/c mice administered i.n. with PBS, Ad-Empty or Ad-hACE2 (2.5×10⁸, 1×10⁸, or 7.5×10⁷ PFU) were infected five days later (D5) with 1×10⁴ pfu of SARS-CoV-2 and lung viral titers were determined by plaque assay on D2 and D5 post-SARS-CoV-2 challenge. Note; data points for viral lung titers for BALB/c mice treated with Ad-hACE2 at a dose of 2.5×10⁸ PFU shown in (F), are the same group of mice as shown in (D) and are shown for visualization purposes to allow a comparison between doses, although all groups were part of the same larger experiment.
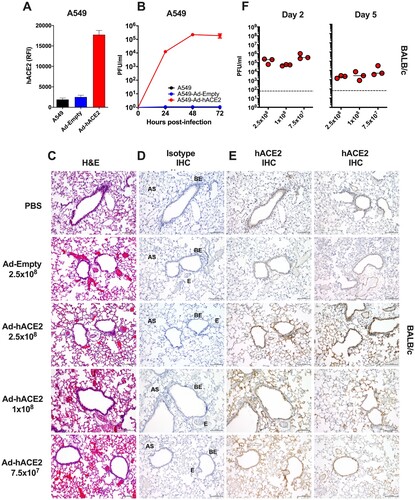
Figure 2. B6 and BALB/c Ad-hACE2 SARS-CoV-2 infection (A-B-E) B6 mice and (C-D) Balb/c mice were transduced with 2.5×10⁸ PFU of Ad-empty, Ad-hACE2, or PBS. On D5 post-Ad administration mice were infected with 1×10⁴ pfu of SARS-CoV-2 and monitored for weight loss (A and C) and viral titers (B,D, and E) according to the indicated timeline. n = animal number at day 0, as animals were harvested for titers n was reduced according to the diagram. Note; data points for viral lung titers for Balb/c mice treated with Ad-hACE2 at a dose of 2.5×10⁸ PFU shown in (D), are the same group of mice as shown in (F).
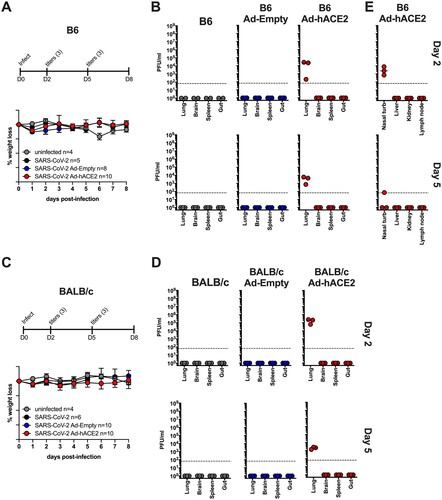
Figure 3. B6-K18-hACE2 SARS-CoV-2 infection. B6 K1 8-hACE2 mice were infected with 1×10⁴ PFU of SARS-CoV-2 and monitored for weight loss (A) and viral titers (B and C) according to the indicated timeline. n = animal number at day 0, as animals were harvested for titers n was reduced according to the diagram.
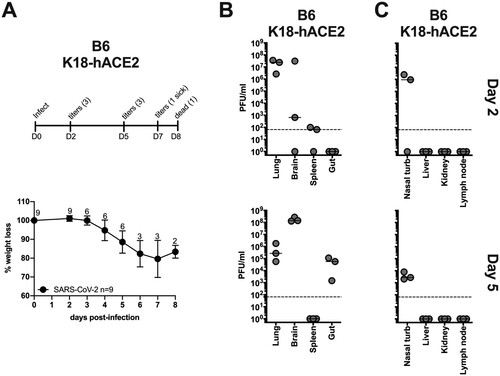
Figure 4. Comparison of histology and immunohistochemistry on lung and brain tissue from B6 AdhACE2 or K18-hACE2 animal models following SARS-CoV-2 challenge. (A) Paraffin lung sections (5μm) from B6 mice administered intranasally (i.n) with 2.5×10⁸ PFU Ad-hACE2 and subsequently challenged with 1×10⁴ PFU of SARS-CoV-2 were stained by H&E, or for SARS-CoV-2 N protein (n=3 per group, per timepoint). Lungs were harvested on D0, D2, D5 and D6 post-challenge. Regions of the lung anatomy are indicated on images for negative control polyclonal IgG (pIgG) antibody sections: AS = alveolar septa or BE = bronchiolar epithelium. Black arrow indicates regions of specific dark brown/red anti-SARS-CoV-2 N staining for less obvious regions of positive labelling. (B) Paraffin brain sections (5μm) from B6 Ad-hACE2, as above. Regions of brain anatomy are indicated: OB = olfactory bulb, CC = cerebral cortex. (C) H&E sections and IHC-P for SARS-CoV-2 N was also performed on lung and (D) brain tissue sections from K18-hACE2 transgenic mice at the same time-points post-challenge with SARS-CoV-2. Scale bar on all images is 200 nm, IHC-P staining is indicated by red staining for Nova Red substrate.
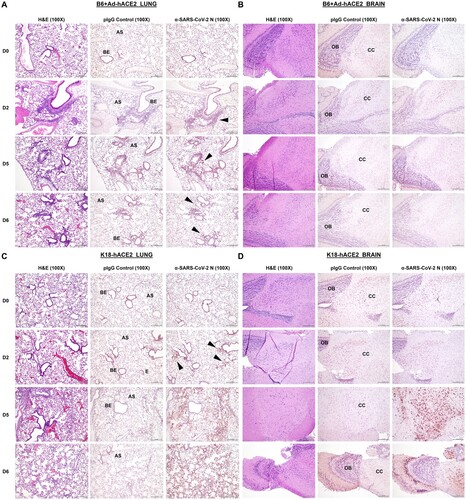
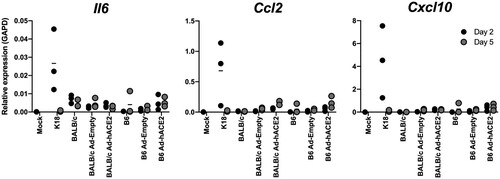
Figure 5. B6-K18-hACE2, BALB/c Ad-ACE2, and B6 Ad-ACE2 cytokine/chemokine induction. Cytokine/chemokine production in the lung was measured by qPCR at day 2 or 5 post-infection for samples in and .