Figures & data
Figure 1. C. albicans activates host plasminogen to promote invasive infection. (A) Representative confocal microscope analysis of human plasminogen binding with C. albicans SC5314. Scale bar represents 10 μm. (B, C) Assay for yeast or hyphal form of C. albicans SC5314-induced plasminogen activation and the effect of plasminogen activation inhibitor ϵ-ACA (20 mM). (D) Plasminogen promoted the damage effects of C. albicans on HUVECs and the effect of ϵ-ACA (20 mM). HUVECs damage was determined by assaying LDH release after 12 h co-cultured with C. albicans SC5314 (MOI = 0.1). (E-F) C57BL/6 mice were treated ϵ-ACA (30 mg/kg) or vehicle control twice daily for 5 days after intravenously infection with C. albicans SC5314 (1 × 10⁶ CFU per mouse, E-H). (E) Survival of the mice was monitored for 30 days. (F) The kidney fungal burden of the mice was determined at day 2 post-infection. (G, H) Blood urea nitrogen (BUN) and creatinine (CRE) levels in mice were determined at day 2 post-infection. UI, uninfected mice; PLG, Plasminogen. Data are represented as means ± SD from triplicates of one representative experiment of three. * P, < 0.05; ** P, < 0.01; *** P, < 0.001 [One-way ANOVA (B, C, D, G, H); Log-rank test (E); Nonparametric t-test (F)].
![Figure 1. C. albicans activates host plasminogen to promote invasive infection. (A) Representative confocal microscope analysis of human plasminogen binding with C. albicans SC5314. Scale bar represents 10 μm. (B, C) Assay for yeast or hyphal form of C. albicans SC5314-induced plasminogen activation and the effect of plasminogen activation inhibitor ϵ-ACA (20 mM). (D) Plasminogen promoted the damage effects of C. albicans on HUVECs and the effect of ϵ-ACA (20 mM). HUVECs damage was determined by assaying LDH release after 12 h co-cultured with C. albicans SC5314 (MOI = 0.1). (E-F) C57BL/6 mice were treated ϵ-ACA (30 mg/kg) or vehicle control twice daily for 5 days after intravenously infection with C. albicans SC5314 (1 × 10⁶ CFU per mouse, E-H). (E) Survival of the mice was monitored for 30 days. (F) The kidney fungal burden of the mice was determined at day 2 post-infection. (G, H) Blood urea nitrogen (BUN) and creatinine (CRE) levels in mice were determined at day 2 post-infection. UI, uninfected mice; PLG, Plasminogen. Data are represented as means ± SD from triplicates of one representative experiment of three. * P, < 0.05; ** P, < 0.01; *** P, < 0.001 [One-way ANOVA (B, C, D, G, H); Log-rank test (E); Nonparametric t-test (F)].](/cms/asset/f536fb80-c34c-4da0-a078-9c894c350608/temi_a_1840927_f0001_oc.jpg)
Figure 2. Eno1 plays a central role in C. albicans activating human plasminogen. (A) ELISA assays for recombinant C. albicans cell wall proteins binding to human plasminogen. Recombinant C. albicans Eno1 binding to human plasminogen was regarded as 100 percent. (B) Assays for the ability of recombinant C. albicans cell wall proteins to activate human plasminogen. Recombinant C. albicans Eno1 activating human plasminogen was regarded as 100 percent. (C) ELISA assays for recombinant C. albicans Eno1 binding to human plasminogen. Recombinant C. albicans Eno1 (2.5 μg) binding to human plasminogen was regarded as 100 percent. (D) Assays for recombinant C. albicans Eno1-induced activation of human plasminogen. Recombinant C. albicans Eno1 (2.5 μg) activating plasminogen was regarded as 100 percent. (E-J) Eno1 expression at protein level and mRNA level during C. albicans SC5314 invading human endothelial or epithelial cells in vitro. HUVECs (E, G, I) and Caco-2 intestinal epithelial cells (F, H, J) were co-cultured with C. albicans SC5314 for the indicated time (MOI = 1). C. albicans cell wall-localized (E, F) or cytoplasmic (G, H) Eno1 protein were determined by western blot and Eno1 mRNA expression levels were determined by Q-PCR (I, J). PLG, Plasminogen. Data shown in (A-D), (I) and (J) are means ± SD of triplicates from one representative experiment of three. The immunoblotting analysis shown in (E-H) are representative of three independent experiments. ** P, < 0.01 *** P, < 0.001 (One-way ANOVA).
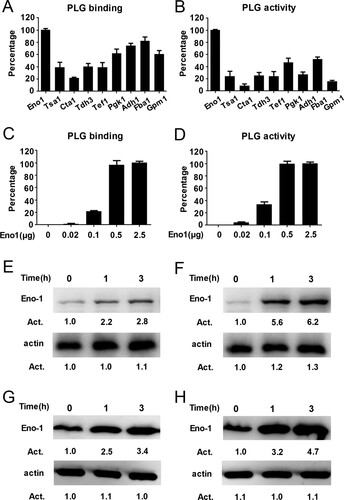
Figure 2. Continued.
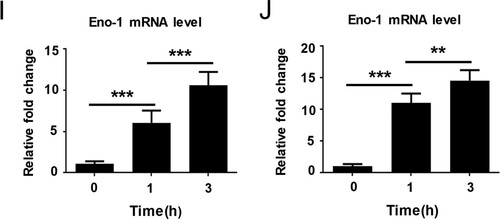
Figure 3. mAb 12D9 targeting C. albicans Eno1 displayed high affinity with recombinant Eno1 and C. albicans cell. (A)Western blot analysis to verify the specificity of mAb 12D9. Recombinant C. albicans Eno1 (Band a), cell wall extracts (Band b), and cytoplasmic extracts (Band c) from C. albicans SC5314 were fracted by SDS-PAGE and then subjected to immunoblotting analysis with mAb 12D9. The western bolt analysis are representative of three independent experiments. (B) ELISA assay for mAb 12D9 binding to recombinant C. albicans Eno1. (C) SPR analysis for interaction between the mAb 12D9 and recombinant C. albicans Eno1. Data shown in (B) and (C) come from one representative experiment of three. (D) Representative confocal microscope analysis for mAb 12D9 binding to C. albicans SC5314. Scale bar represents 10 μm. (E) Representative images analysed by flow cytometry for detection of mAb 12D9 binding to C. albicans. Data shown in (D, E) are representative images of three experiments.
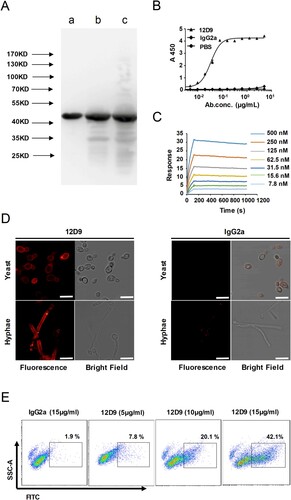
Figure 4. mAb 12D9 could block C. albicans capturing and activating human plasminogen. The assay for C. albicans Eno1 binding to (A) and activating (B) human plasminogen in the presence of the indicated concentration of mAb 12D9. Recombinant C. albicans Eno1 binding to and activating plasminogen in the absence of mAb 12D9 were regarded as 100 percent. (C) The assays for C. albicans SC5314 activating human plasminogen in the presence of mAb 12D9 (10μg). PLG, Plasminogen. Bla, Blank. ** P, < 0.01[One-way ANOVA (A, C)].
![Figure 4. mAb 12D9 could block C. albicans capturing and activating human plasminogen. The assay for C. albicans Eno1 binding to (A) and activating (B) human plasminogen in the presence of the indicated concentration of mAb 12D9. Recombinant C. albicans Eno1 binding to and activating plasminogen in the absence of mAb 12D9 were regarded as 100 percent. (C) The assays for C. albicans SC5314 activating human plasminogen in the presence of mAb 12D9 (10μg). PLG, Plasminogen. Bla, Blank. ** P, < 0.01[One-way ANOVA (A, C)].](/cms/asset/0123aefa-bee3-4cdb-bebe-334388405deb/temi_a_1840927_f0004_ob.jpg)
Figure 5. mAb 12D9 blocks C. albicans developing invasive infection. (A, B) HUVECs (A) and Caco-2 intestinal epithelial cells (B) damage induced by C. albicans in the presence of plasminogen and mAb 12D9 (10 μg/mL) was determined by assaying LDH release. Relative levels of LDH release from HUVECs or Caco-2 intestinal epithelial cells were measured after 6 h of co-culture with C. albicans (MOI = 0.1). (C) Phagocytosis of C. albicans by thioglycollate-elicited peritoneal macrophages. C. albicans SC5314 was co-cultured with peritoneal macrophages and the indicated concentration of mAb 12D9 at 37°C for 1 h (MOI = 0.4). The suspension was then plated on SDA agar for 48 h, after which C. albicans colonies were counted and the phagocytosis percent was calculated. (D) Killing of C. albicans by thioglycollate-elicited peritoneal neutrophil. C. albicans SC5314 cells were co-cultured with peritoneal neutrophils and the indicated concentration of mAb 12D9 at 37°C for 1 h. The suspension was then plated on SDA agar for 48 h, after which C. albicans colonies were counted and the killing percent was calculated. Data in (A-D) are represented as means ± SD from triplicates of one representative experiment of three. (E-G) C57BL/6 mice were infected with 1 × 10⁶ CFU of C. albicans SC5314 and treated with mAb 12D9 (30 mg/kg) and/or anidulafungin (AN) (0.1 mg/kg) via the lateral tail vein. (E) Survival of mice was monitored for 30 days (n = 10 per group). (F) Quantification of the fungal burden in the kidneys of mice (n = 6 per group) at day 2 post-infection. (G) Representative H&E (for determining inflammatory cell influx and the extent of tissue necrosis) and PAS (for C. albicans) staining of kidneys from infected mice with the indicated treatment at day 2 post-infection. Arrows indicate inflammatory cells influx and tissue necrosis (H&E staining) and C. albicans filaments in the tissues (PAS staining). Magnification 200×. Data in (G-J) are representative of three independent experiments. *, P < 0.05; ***, P < 0.001[One-way ANOVA (A-D); Log-rank test (E); Nonparametric One-way ANOVA (F)].
![Figure 5. mAb 12D9 blocks C. albicans developing invasive infection. (A, B) HUVECs (A) and Caco-2 intestinal epithelial cells (B) damage induced by C. albicans in the presence of plasminogen and mAb 12D9 (10 μg/mL) was determined by assaying LDH release. Relative levels of LDH release from HUVECs or Caco-2 intestinal epithelial cells were measured after 6 h of co-culture with C. albicans (MOI = 0.1). (C) Phagocytosis of C. albicans by thioglycollate-elicited peritoneal macrophages. C. albicans SC5314 was co-cultured with peritoneal macrophages and the indicated concentration of mAb 12D9 at 37°C for 1 h (MOI = 0.4). The suspension was then plated on SDA agar for 48 h, after which C. albicans colonies were counted and the phagocytosis percent was calculated. (D) Killing of C. albicans by thioglycollate-elicited peritoneal neutrophil. C. albicans SC5314 cells were co-cultured with peritoneal neutrophils and the indicated concentration of mAb 12D9 at 37°C for 1 h. The suspension was then plated on SDA agar for 48 h, after which C. albicans colonies were counted and the killing percent was calculated. Data in (A-D) are represented as means ± SD from triplicates of one representative experiment of three. (E-G) C57BL/6 mice were infected with 1 × 10⁶ CFU of C. albicans SC5314 and treated with mAb 12D9 (30 mg/kg) and/or anidulafungin (AN) (0.1 mg/kg) via the lateral tail vein. (E) Survival of mice was monitored for 30 days (n = 10 per group). (F) Quantification of the fungal burden in the kidneys of mice (n = 6 per group) at day 2 post-infection. (G) Representative H&E (for determining inflammatory cell influx and the extent of tissue necrosis) and PAS (for C. albicans) staining of kidneys from infected mice with the indicated treatment at day 2 post-infection. Arrows indicate inflammatory cells influx and tissue necrosis (H&E staining) and C. albicans filaments in the tissues (PAS staining). Magnification 200×. Data in (G-J) are representative of three independent experiments. *, P < 0.05; ***, P < 0.001[One-way ANOVA (A-D); Log-rank test (E); Nonparametric One-way ANOVA (F)].](/cms/asset/604ac82a-c66e-478f-942c-47a634af98ef/temi_a_1840927_f0005_oc.jpg)
Figure 6. Maximal activity of mAb 12D9 against C. albicans infection depends on host plasminogen. (A) HUVECs damage was determined by assaying LDH release. Relative levels of LDH release from HUVECs were measured after 6 h of co-culture with C. albicans (MOI = 0.1) in the presence of indicated plasminogen, mAb 12D9 (4μg/mL) and ϵ-ACA (20 mM). (B-F) C57BL/6 mice were treated with ϵ-ACA (30 mg/kg) twice daily for 5 days to abolish plasminogen system after intravenously infection with C. albicans SC5314 (1 × 10⁶ CFU). (B) Survival of mice with the indicated mAb 12D9 (30 mg/kg) and/or anidulafungin (AN) (0.1 mg/kg) treatment was monitored for 30 days (n = 10 per group). (C, D) Quantification of fungal burden in kidneys (C) and liver (D) of mice treated with mAb 12D9 (30 mg/kg) and/or anidulafungin (0.1 mg/kg) (n = 6 per group) at day 2 post-infection. (E, F) Blood urea nitrogen (BUN) (E) and creatinine (CRE) (F) in mice were determined at day 2 post-infection. UI, uninfected mice. Data in (A-F) are representative of three independent experiments. **, P < 0.01; ***, P < 0.001; [Nonparametric One-way ANOVA (A, C-F); Log-rank test (B)].
![Figure 6. Maximal activity of mAb 12D9 against C. albicans infection depends on host plasminogen. (A) HUVECs damage was determined by assaying LDH release. Relative levels of LDH release from HUVECs were measured after 6 h of co-culture with C. albicans (MOI = 0.1) in the presence of indicated plasminogen, mAb 12D9 (4μg/mL) and ϵ-ACA (20 mM). (B-F) C57BL/6 mice were treated with ϵ-ACA (30 mg/kg) twice daily for 5 days to abolish plasminogen system after intravenously infection with C. albicans SC5314 (1 × 10⁶ CFU). (B) Survival of mice with the indicated mAb 12D9 (30 mg/kg) and/or anidulafungin (AN) (0.1 mg/kg) treatment was monitored for 30 days (n = 10 per group). (C, D) Quantification of fungal burden in kidneys (C) and liver (D) of mice treated with mAb 12D9 (30 mg/kg) and/or anidulafungin (0.1 mg/kg) (n = 6 per group) at day 2 post-infection. (E, F) Blood urea nitrogen (BUN) (E) and creatinine (CRE) (F) in mice were determined at day 2 post-infection. UI, uninfected mice. Data in (A-F) are representative of three independent experiments. **, P < 0.01; ***, P < 0.001; [Nonparametric One-way ANOVA (A, C-F); Log-rank test (B)].](/cms/asset/b3b36d78-9964-457b-8c0d-0e195e830a1c/temi_a_1840927_f0006_oc.jpg)
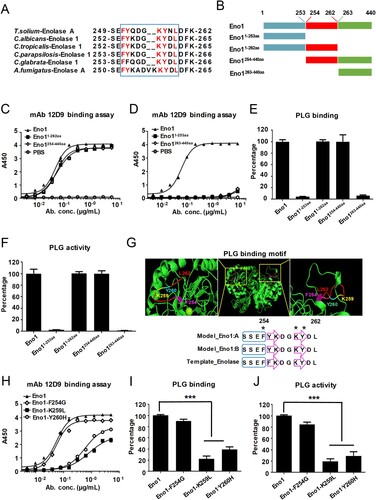
Figure 7. mAb 12D9 binds motif 254FYKDGKYDL262 in H6S6 loop of C. albicans Eno1 to prevent it activating plasminogen. (A) Alignment of the H6S6 loop amino acid sequences of T. solium enolase A with enolase of fungal species including C. albicans, C. tropicalis, C. parapsilosis, C. glabrata and A. fumigatus. (B) Schematic diagram of different domains of recombinant C. albicans Eno1. (C, D) ELISA assay for mAb 12D9 binding to C. albicans Eno1 and its different domains (Eno1254-440aa and Eno11-262aa, C; Eno1263-440aa and Eno11-253aa, D). (E) Plasminogen-binding assay with different domains of recombinant C. albicans Eno1. (F) Plasminogen activation induced by different domains of recombinant C. albicans Eno1. (G) Structural model of C. albicans Eno1 (homo-dimer) generation using Swiss-Model. Putative Eno1-plasminogen interaction motif was marked in red, and the key plasminogen-binding residues (F254G, amaranth; K259L, yellow; Y260H, cyan) were calculated by Swiss-Model and marked with “*”. A blue box stands for α-helices and a purple arrow represents a β-strand. (H) ELISA assay for mAb 12D9 binding to recombinant C. albicans Eno1 and mutations (F254G, K259L and Y260H). (I) Plasminogen-binding assay for recombinant C. albicans Eno1 and mutations (F254G, K259L and Y260H). (J) Plasminogen activation induced by recombinant C. albicans Eno1 and mutations (F254G, K259L and Y260H). Recombinant C. albicans Eno1 binding to and activating plasminogen in the absence of mAb 12D9 were regarded as 100 percent. PLG, Plasminogen. Data in (C-F and H-J) are representative of three independent experiments. *** P, < 0.001 (One-way ANOVA).