Figures & data
Figure 1. Enrollment of HIV-1-infected patients initiated on ART between Jan 1, 2005 and Jun 30, 2018.
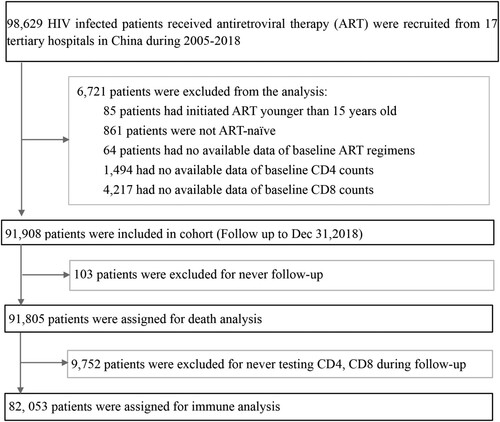
Table 1. Baseline features of HIV-1-infected patients.
Figure 2. The dynamic trajectories of CD4 counts, CD8 counts, CD4/CD8 ratio in HIV-1 patients based on five groups of baseline CD4 counts over a 12 years follow-up period. Although the CD4 counts were quickly restored to above 500 cells/µL after ART in patients with baseline CD4 counts ≥350 cells/µL, in advanced HIV-1 patients (CD4 counts <200 or <50 cells/μL), the restoration of CD4 counts was slower and more difficult to reach 500 cells/μL even after 12 years of ART (A). HIV-1-infected patients on ART usually displayed high levels of CD8 counts (B), and rarely showed restoration of normal CD4/CD8 ratio(C) during the 12-year follow-up among patients with different baseline CD4 counts. The pink shaded areas in A and B represent a range of mean CD4 and CD8 counts in Chinese healthy population from different researches, respectively. Dash symbol in “Number at risk” means that when the numbers of patients were less than 200 in the corresponding follow-up points, we will not exhibit the trajectories. IQR = inter quartile range.
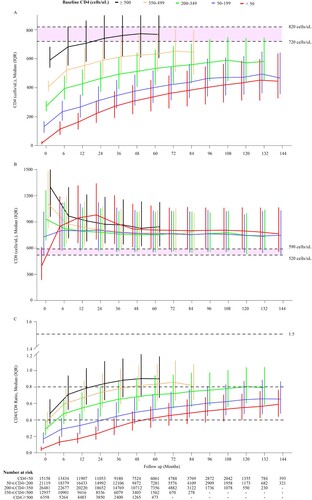
Figure 3. The cumulative probability of restoration of CD4 count and CD4/CD8 ratio in HIV-1-infected patients after ART initiation. Analyses of the cumulative probability of CD4 counts reaching above 200 (A), 350 (B), and 500 cells/μL (C). The cumulative probability of CD4/CD8 ratio reaching above 0.4 (D) and 0.8 (E).
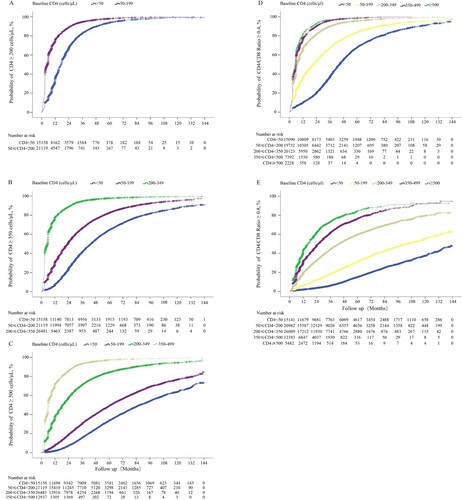
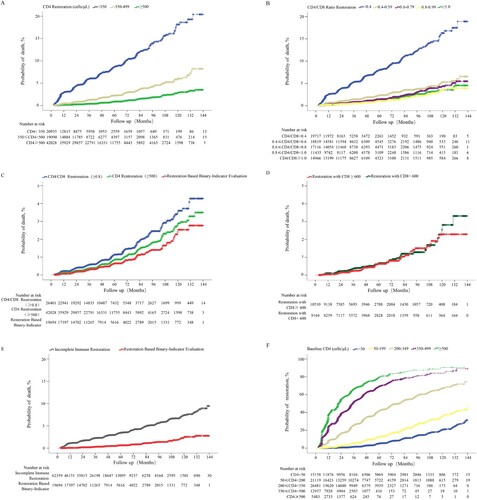
Figure 4. Cumulative probability of death among HIV-1-infected patients on ART. Estimation of changes in mortality rates in patients with different baseline CD4 counts during the first year of ART based on different ART eligibility criteria (A). Cumulative probability of death stratified by different baseline CD4 counts (B), different baseline CD8 counts (C), and different baseline CD4/CD8 ratios (D).
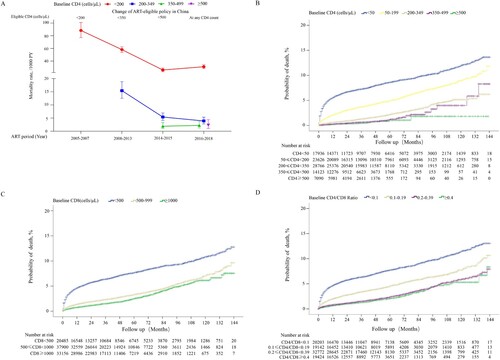
Figure 5. Cox proportional hazard regression analysis to identify factors associated with mortality. For regression analysis, the mortality rate per 10,000 person-years was adjusted for age, sex, infection route, WHO clinical stages, HBsAg positive, Anti-HCV positive, tuberculosis, baseline hemoglobin, baseline CD4 count, baseline CD8 count, and ART regimen. The rate difference was calculated as the adjusted mortality rate of patients on ART. The boxes represent hazard ratios, the horizontal lines represent 95% CI. MSM, men who have sex with men; HC, heterosexual contact; IDU, injecting drug users; BT, blood transfusion; Hb, hemoglobin; ART, antiretroviral therapy; MR, mortality rate; AHR, adjusted hazard ratio; HBsAg, hepatitis B surface antigen; Anti-HCV, antibody to hepatitis C virus; NNRTI, non-nucleoside reverse transcriptase inhibitor; PI, protease inhibitor.
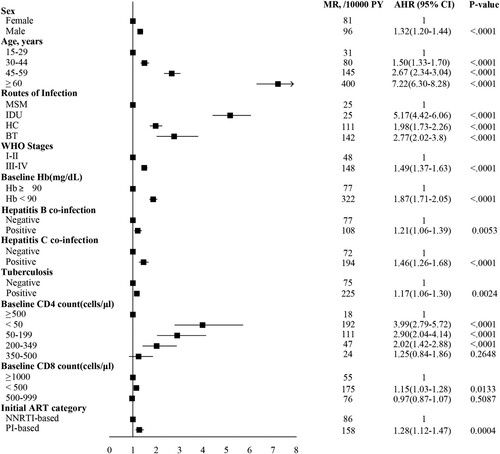
Figure 6. Comparison of cumulative probability of death among HIV-1-infected patients with different immune restoration status. Comparison of the cumulative probability of death between HIV-1-infected patients achieving CD4 counts ≥350, 350–499, and ≥500 cells/μL (A), CD4/CD8 ratio <0.4, 0.4–0.59, 0.6–0.79, 0.8–0.99, and ≥1.0 (B), CD4 counts ≥500 cells/μL, CD4/CD8 ratio ≥0.8, and binary indicator-based immune restoration (simultaneously achieving CD4 counts ≥500 cells/μL and CD4/CD8 ratio ≥0.8) (C), binary indicator-based immune restoration with CD8 counts ≥600 and <600 cells/μL (D), binary indicator-based immune restoration and incomplete immune restoration (E). The cumulative probability of binary indicator-based immune restoration among patients with different baseline CD4 counts (F).