Figures & data
Figure 1. The COVID-19 pandemic trends in North America: USA (left panel) and Canada (right panel), by the end of June 2020. Total of cumulated COVID-19 cases in USA (A) and Canada (D): reported cases (blue) and predicted cases (red). Daily growth rate of COVID-19 cases in USA (B) and Canada (E): actual daily growth rate (blue), 5-day moving average of the growth rate (black) and exponential fix and predicted growth rate (red). Daily new COVID-19 cases in USA (C) and Canada (F): reported numbers (blue curve) and predicted numbers (red).
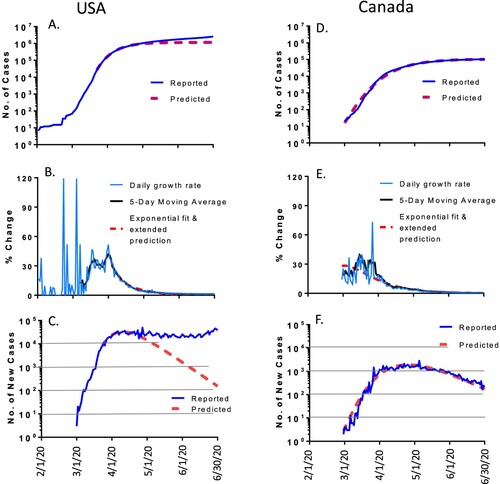
Table 1. The predicted and actual total numbers of COVID19 cases in US states and other countries included in the current report.
Figure 2. The COVID-19 pandemic trends in representative states in the USA, matching the modeling well (<10% variation of total cases by 30 June 2020): Illinois (IL, left panel) and New Jersey (NJ, right panel). Total cumulative COVID-19 cases in IL (A) and NJ (D): reported cases (blue) and predicted cases (red). Daily growth rate of COVID-19 cases in IL (B) and NJ (E): actual daily growth rate (blue), 5-day moving average of the growth rate (black) and exponential fix and predicted growth rate (red). Daily new COVID-19 cases in IL (C) and NJ (F): reported numbers (blue) and predicted numbers (red).
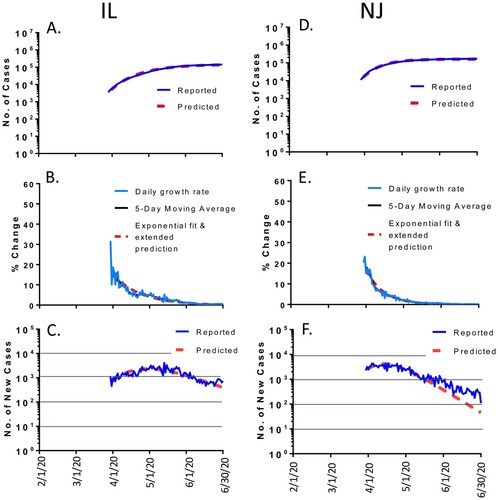
Figure 3. The COVID-19 pandemic trends in representative states in the USA, partially matching the modeling (10-50% variation of total cases by 30 June 2020): Massachusetts (MA, left panel), New York (NY, middle panel) and Pennsylvania (PA, right panel). Total cumulative COVID-19 cases in MA (A), NY (D) and PA (G): reported cases (blue) and predicted cases (red). Daily growth rate of COVID-19 cases in MA (B), NY (E) and PA (H): actual daily growth rate (blue), 5-day moving average of the growth rate (black) and exponential fix and predicted growth rate (red). Daily new COVID-19 cases in in MA (C), NY (F) and PA (I): reported numbers (blue) and predicted numbers (red).
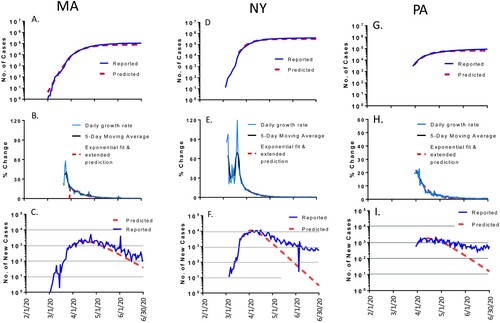
Figure 4. The COVID-19 pandemic trends in representative states in the USA, matching the modeling poorly (>50% variation of total cases by 30 June 2020): Michigan (MI, left panel), Nevada (NV, middle panel) and California (CA, right panel). Total cumulative COVID-19 cases in MI (A), NV (D) and CA (G): reported cases (blue) and predicted cases (red). Daily growth rate of COVID-19 cases in MI (B), NV (E) and CA (H): actual daily growth rate (blue), 5-day moving average of the growth rate (black) and exponential fix and predicted growth rate (red). Daily new COVID-19 cases in MI (C), NV (F) and CA (I): reported numbers (blue) and predicted numbers (red).
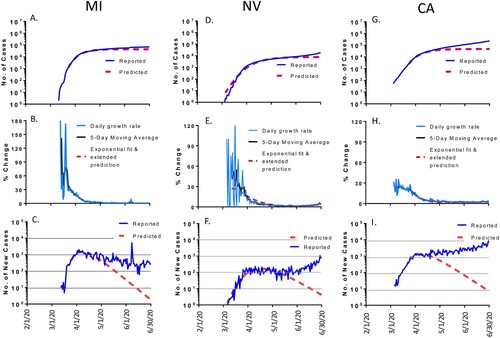
Figure 5. The COVID-19 pandemic trends in selected European countries by the end of June 2020: from left to right panels are France, Germany, Italy, Spain and British (UK). Total cumulative COVID-19 cases in France (A), Germany (D), Italy (G), Spain (J) and UK (M): reported cases (blue) and predicted cases (red). Daily growth rate of COVID-19 cases in France (B), Germany (E), Italy (H), Spain (K) and UK (N): actual daily growth rate (blue), 5-day moving average of the growth rate (black) and exponential fix and predicted growth rate (red). Daily new COVID-19 cases in France (C), Germany (E), Italy (I), Spain (L) and UK (O): reported numbers (blue) and predicted numbers (red).
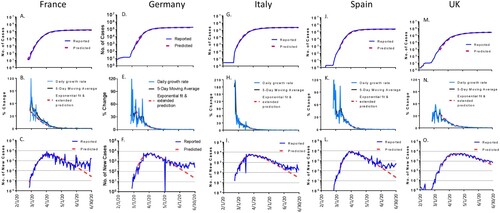
Figure 6. The COVID-19 pandemic trends in Oceania by the end of June 2020: Australia (left panel) and New Zealand (right panel). Total cumulative COVID-19 cases in Australia (A) and New Zealand (D): reported cases (blue) and predicted cases (red). Daily growth rate of COVID-19 cases in Australia (B) and New Zealand (E): actual daily growth rate (blue), 5-day moving average of the growth rate (black) and exponential fix and predicted growth rate (red). Daily new COVID-19 cases in Australia (C) and New Zealand (F): reported numbers (blue) and predicted numbers (red).
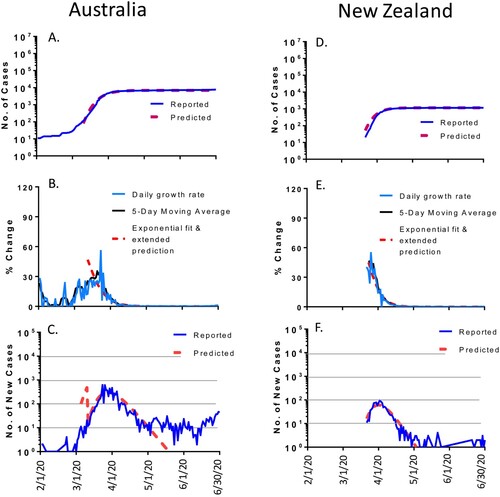
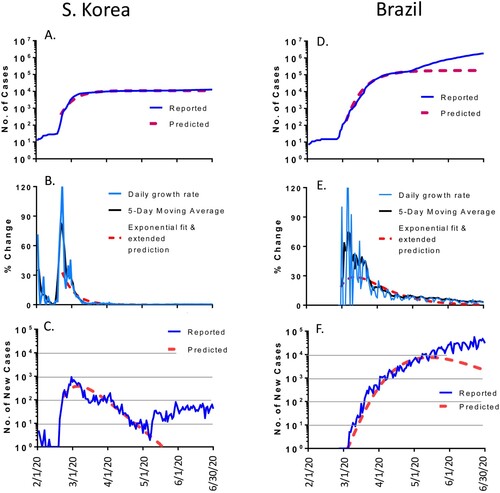
Figure 7. The COVID-19 pandemic trends in other regions by the end of June 2020: South Korea (left panel) and Brazil (right panel). Total cumulative COVID-19 cases in South Korea (A) and Brazil (D): reported cases (blue) and predicted cases (red). Daily growth rate of COVID-19 cases in South Korea (B) and Brazil (E): actual daily growth rate (blue), 5-day moving average of the growth rate (black) and exponential fix and predicted growth rate (red). Daily new COVID-19 cases in South Korea (C) and Brazil (F): reported numbers (blue) and predicted numbers (red).