Figures & data
Table 1. The detailed information of genomes of 27 ST9 isolates downloaded from the National Center for Biotechnology Information (NCBI) for comparison of genetic features of ZY462471.
Table 2. Antimicrobial susceptibility testing of ZY462471.
Figure 1. Construction of phylogenetic tree among ST9 isolates. Twenty-eight ST9 strains genome sequences were aligned. The information of ST9 strains is shown on the left, including the location, host, and the presence of SCCmec type and spa type. To reduce the number of parameters in the model, we grouped samples into seven geographical regions: Taiwan, Shandong, Fujian, Zhejiang, Shaanxi, Ningxia, and Guangdong. To explore putative host switching in ST9, we also added the sampled host as a discrete trait to the model. Three possible hosts were included human, bovine, and pig.
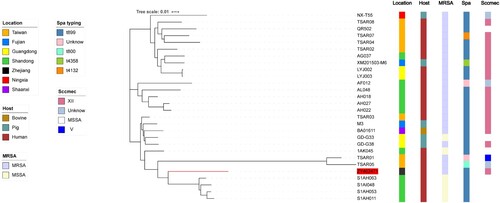
Figure 2. Comparison of the chromosome of ZY46241 and S1AH063. (a) shows the distribution of the different SNPs between our strain ZY462471 and S1AH063 on different contigs. There are totally thirty-eight contigs. The colour in the lower right corner represents the number of nucleic acid variation on different contigs. (b) shows the chromosomal difference between ZY462471 and S1AH063. Each circle represents the chromosomes of different strains, and the blank places indicate differences. TSAR01, NT-X55, and cp028191 were used as reference strains. Strains are grouped in different colours. The SCCmec cassette is marked in black frames.
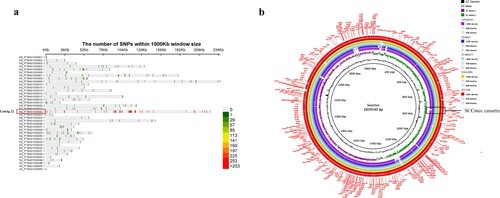
Figure 3. The heatmap of antibiotic resistance gene profiles and virulence genes across the 28 ST9 S. aureus isolates. Coloured blocks represent the presence of genes and white blocks represent absence. The horizontal colour bar from left to right represents the involved genes in β-lactamase, aminoglycoside, phenicols, tetracycline, MLS, trimethoprim, heavy metal resistance, efflux pumps, haemolysins, adherence-associated genes, exoenzymes, staphylococcal enterotoxins, secretion systems, and other virulence genes. The strain ZY462471 used in this study was marked with red colour. The detailed information of other 27 ST isolates was shown in .
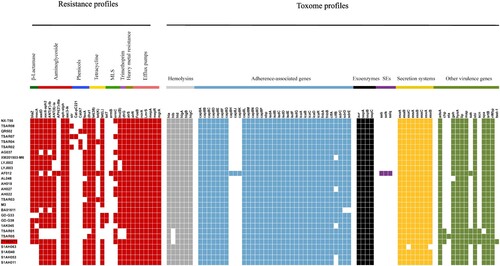
Figure 4. Virulence phenotype of MRSA ST9 isolate ZY462471. (a) The Survival rates of ZY42671 infected with Galleria mellonella larvae. One hundred larvae were used per strain. G. mellonella larvae were inoculated with 50 µl each strain at doses ranging from 5×10⁴ and incubated at 37°C; the viability was assessed over 40 h. (b) The Triton X-100 solution group (added to 1% rabbit RBCs) was used as the positive control, and 0.9% NaCl solution was used as the negative control. The absorbance at 600 nm of each sample was recorded. All data were calibrated with negative controls. (c) The cytotoxicity assay was performed in accordance with the following controls. (1) exp. value: the absorbance value of each experimental sample. (2) low control: the absorbance value of culture medium background. (3) high control: the absorbance value of the positive control (maximum LDH release). Values are indicated as means ± SD (three repeated experiments). * represents p < 0.05. ** represents p < 0.01.
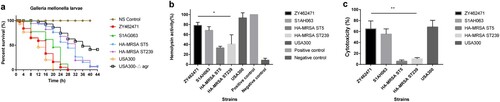
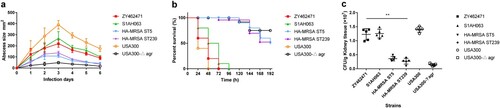
Figure 5. The mouse systemic infection model and skin infection model caused by ZY462471 compared with that of caused by its closest ST9 MSSA neighbour S1AH063 and HA-MRSA ST5 strain, HA-MRSA ST239 strain, and CA-MRSA USA300 and its agr mutant USA300△agr. (a) Abscess sizes in the mouse skin infection model. Three mice were used per strain. (b) Survival analysis of mice (n = 10 per strain) injected with 2×10⁸ CFU of strains or NaCl solution. Survival curves were compared using a log-rank (Mantel-Cox) test. (c) The number of CFUs in the kidneys was determined by plating samples on TSB agar.