
Figures & data
Figure 1. Time periods of each observation in the vaccinated and control groups. The matching of potential individuals for the control group and further selection of control group individuals is as following. (1) Vaccinated individuals were matched to all inpatient and outpatient medical occurrences of controls using age at index date/medical occurrence, sex, and district. (2) The index date of each vaccinated individual were assigned to the matched potential controls. (3) Four controls among the matched potential controls were randomly selected for each vaccinated individual. (4) Some individuals in the control group might have multiple appearances because they were matched to more than one vaccinated individual with distinct index dates. To resolve this, a distinct set of control observations were further filtered by keeping the observation of each control with the earliest index date.
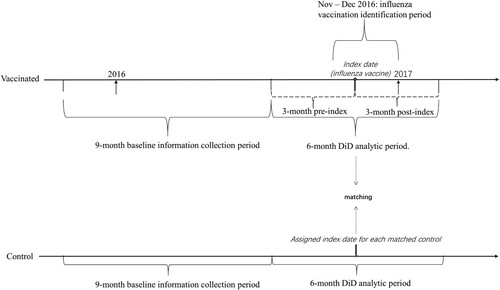
Figure 2. Flowcharts of sample selection in the vaccinated and control groups.
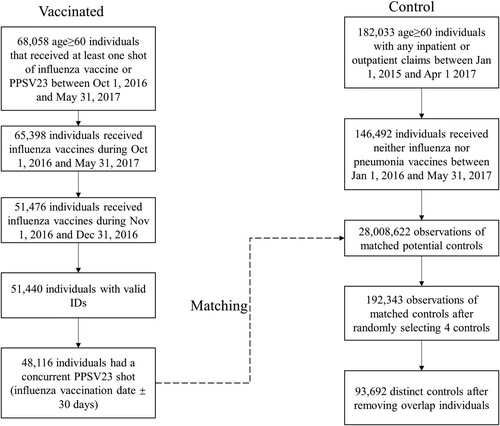
Table 1. Demographic and baseline clinical characteristics of the vaccinated and control groups before and after entropy balancing.
Figure 3. Percentages of samples that had all-cause and acute respiratory hospitalizations in each month of the difference-in-difference analytic time period.
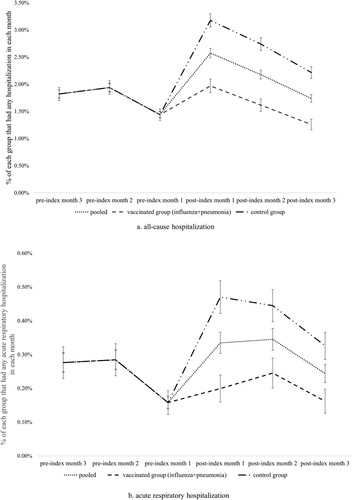
Table 2. Results of weighted logistic regressions using difference-in-difference specifications.
supplementary_materials.docx
Download ()Data availability
The data that support the findings of this study are available from the Shenzhen Medical Informatics Center. Restrictions apply to the availability of these data, which were used under a license for studies. Data are available from the authors upon reasonable requests for requestors who have permission from Shenzhen Medical Informatics Center.