
Figures & data
Figure 1. SARS-CoV-2 spike receptor binding data. A VSV pseudotype assay was used to assess the binding affinity of the SARS-CoV-2 RBD. BHK cells expressing either the human or Syrian hamster or no ACE2 receptor were infected with VSV-pseudotyped particles carrying either the SARS-CoV-1 spike (S) protein or a chimeric SARS-CoV-1 spike with the SARS-CoV-2 receptor binding domain (RBD). Note: red circles, SARS-CoV-1 S; yellow circles with red outline, SARS-CoV-1 S with SARS-CoV-2 RBD; black circle, no ACE-2; S, spike protein; RBD, receptor binding domain.
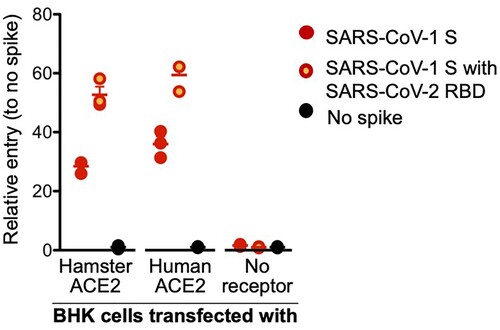
Figure 2. Susceptibility of Syrian hamsters to SARS-CoV-2. Syrian hamsters were inoculated intranasally with 10-fold limiting dilutions of SARS-CoV-2 beginning at 103 TCID50. Weights were collected daily and shedding was assessed via swab samples (nasal and rectal) collected at 3 and 5 dpi. Viral loads were determined as genome copies and infectious virus. (A) Daily weights. (B) Shedding at 3 dpi. (C) Shedding at 5 dpi. (D) Viral genome load in the lungs at 5 dpi. (E) Infectious lung titres at 5 dpi. A statistical significance was found between the groups presented in (A), with the group receiving the highest dose of 103 TCID50 losing the most weight. The group receiving the second highest infectious dose (102 TCID50) lost statistically less than the 103 TCID50 group but statistically more weight than the 2 groups receiving the two lowest infectious doses. (B-E) A statistically significance difference was found between the group receiving the lowest dose (100 TCID50) and all other groups. Multiple t tests comparing groups directly were used to analyse significance. Note: blue circles, 100 TCID50 dose; red square, 101 TCID50 dose; green triangle, 102 TCID50 dose; purple triangle, 103 TCID50 dose.
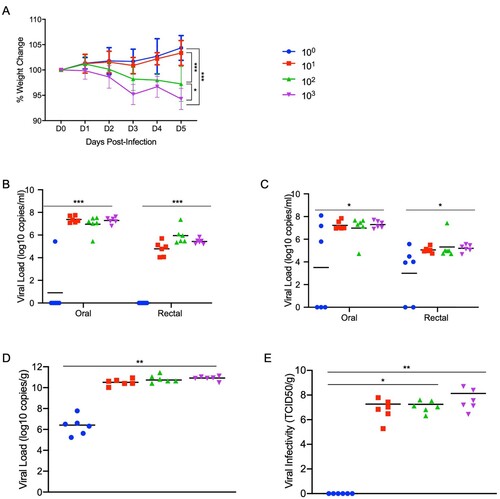
Figure 3. Increased infectious dose does not affect shedding or disease severity. Syrian hamsters were infected intranasally with either 500 ID50 (103 TCID50) or 5 × 10⁴ ID50 (105 TCID50) of SARS-CoV-2. Samples were collected at the time points noted. Weight were collected daily, shedding from mucosal membranes and viral genome load and infectivity in the lungs were measured. (A) Daily weights. (B) Viral genome load recovered from nasal swabs. (C) Viral genome load recovered from rectal swabs. (D) Viral genome load in the lungs. (E) Infectious titres in the lungs. T-tests were used to compare the two groups at each time where samples were collected. A significant difference was observed at 10 dpi in the lung titres (E), but no other significant differences were observed in this study. Note: blue circles, 105 TCID50 dose; red square, 103 TCID50 dose.
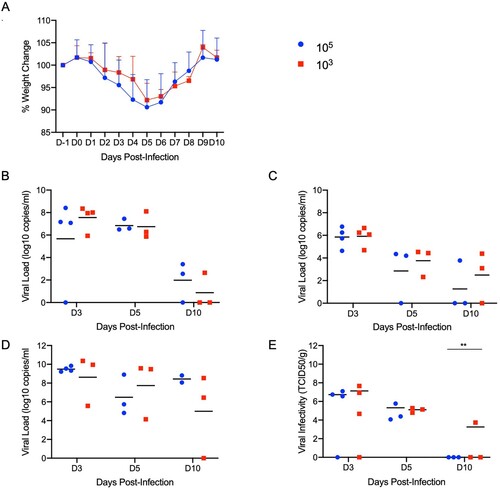
Figure 4. SARS-CoV-2 infection of Syrian hamsters results in broncho-interstitial pneumonia. Syrian hamsters were infected intranasally with 500 ID50 (103 TCID50) of SARS-CoV-2. Lungs were fixed in 10% formalin, cut and stained with Hematoxylin and Eosin (HE) to examine pulmonary pathology at 3, 5 and 10 dpi. (A-C), 3 dpi. (A) Inflammation initiates within interstitial spaces in and around terminal airways with a minimal cellular exudate into the airway spaces (100x, size bar is 50um). (B) Bronchiolar epithelial necrosis with influx of neutrophils into the mucosa and airway lumen (400x, size bar is 20um). (C) Attenuation of the tracheal mucosa with loss of apical cilia accompanied with an influx of moderate numbers of degenerate and non-degenerate neutrophils (400x, size bar is 20um). (D-F), 5 dpi. (D) Locally extensive inflammation is noted (100x, size bar is 50um). (E) Progressive bronchiolitis with degenerate and non-degenerate neutrophils and exudate within the lumen and prominent epithelial syncytial cells (arrows; 400x, size bar is 20um). (F) Alveolar spaces contain macrophages and neutrophils. Alveolar septa are thickened and expanded by fibrin, edema fluid and infiltrating leukocytes and are lined by prominent type II pneumocytes (arrowhead) and rare syncytial cells (arrow; 400x, size bar is 20um). (G-I), 10 dpi. (G) Resolving inflammation is largely limited to bronchioles and the adjacent alveolar spaces (100x, size bar is 50um) (H) Alveolar septa are thickened by collagen with lymphocytes and lined by numerous plump type II pneumocytes that surround low numbers of foamy alveolar macrophages (400x, size bar is 20um). (I) Multifocal pleural fibrosis is evident with mild subpleural inflammation (200x, size bar is 20um). (J-L), naïve animals. (J) Normal interstitial spaces (100x, size bar is 50um). (K) Normal bronchiolar epithelium (400x, size bar is 20um). (L) Normal tracheal mucosa (400x, size bar is 20um).
Figure 5. SARS-CoV-2 viral antigen in the lungs over the course of infection. Syrian hamsters were infected intranasally with 500 ID50 (103 TCID50) of SARS-CoV-2. Histopathology (HE) and immunohistochemistry (IHC) was used to assess pathology with the presence of SARS-CoV-2 antigen in pulmonary sections at 3, 5 and 10 dpi. (A-C), 3 dpi. (A) Histopathology is largely limited to bronchioles and terminal airway spaces and is not readily apparent at a low magnification (H&E, 20x, size bar is 200um). (B) Immunohistochemical reaction highlights antigen distribution in bronchioles and terminal airway spaces (20x, size bar is 200um). (C) Bronchiolar epithelial cell immunoreactivity with limited antigen detection in alveolar spaces (100x, size bar is 50um). (D-F), 5 dpi. (D) Extension of cellular exudate from bronchioles into alveolar spaces (H&E, 20x, size bar is 200um). (E) Immunoreactivity is detected along the periphery of regions of pathology and has largely been cleared from bronchiolar epithelium (20x, size bar is 200um). (F) Immunoreactivity is noted in type I and type II pneumocytes and few alveolar macrophages (200x, size bar is 20um). (G-I), 10 dpi (G) Resolving inflammation is limited to bronchioles and adjacent terminal airways (H&E, 20x, size bar is 200um). (H) SARS-CoV-2 immunoreactivity is not observed in regions of resolving inflammation (20x, size bar is 200um). (I) No immunoreactivity is observed (200x, size bar is 20um). (J-L), naïve animals. (J) Normal interstitial spaces (100x, size bar is 50um). (K) Normal bronchiolar epithelium (400x, size bar is 20um). (L) Normal tracheal mucosa (400x, size bar is 20um).
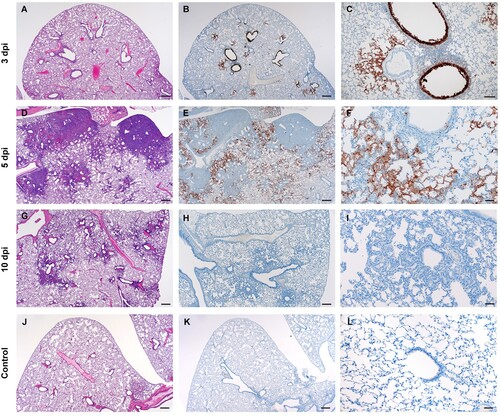
Figure 6. Neither age nor sex affects shedding or disease following infection with SARS-CoV-2. To compare the effects of aging and sex on disease following SARS-CoV-2 infection, young female and male (4-6weeks) and aged female and male (>6months) Syrian hamsters were infected intranasally with 500 ID50 (103 TCID50) of SARS-CoV-2. Samples were collected at the time points noted. Weights were collected daily, shedding and viral loads in the lungs were measured. (A) Daily weights. (B) Viral genome load recovered from oral swabs at each time point. (C) Viral genome load recovered from rectal swabs at each time point. (D) Viral genome load recovered from lungs at each terminal point. (E) Infectious titres in the lungs. ANOVA was used to compare groups at each time where samples were collected. No significant differences were observed between groups at any time point collected in in this study. Note: blue circles, aged females; red circle, aged male; green circle, young female; purple circle, young male.
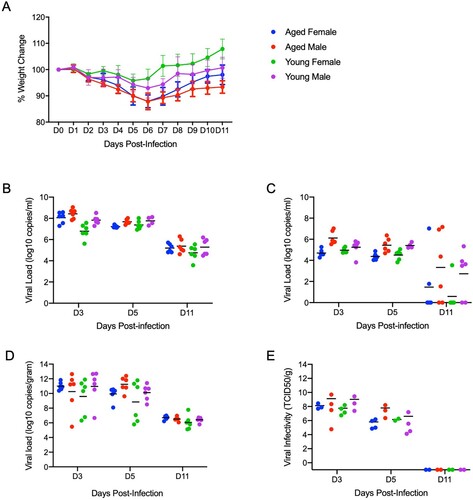
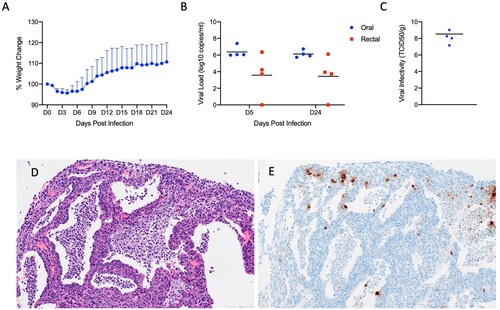
Figure 7. SARS-CoV-2 infection of Interleukin-2 receptor subunit gamma knockout hamsters (IL2RG-/-) results in persistent infection and pneumonia. IL2RG KO hamsters lacking mature B-cells, T-cells and NK cells, were infected with 5 × 10⁴ ID50 (10^5 TCID50) and followed for 24 days to determine if disease developed. Weights were collected daily and shedding from mucosal membranes and viral infectivity in the lungs were measured at the time points noted. (A) Daily weights. (B) Viral genome load recovered from oral and rectal swabs at each time point. (C) Infectious titres in the lungs. (D) Alveoli frequently contain macrophages, neutrophils and sloughed epithelial cells, and are lined by numerous hyperplastic type II pneumocytes (H&E, 200x). (E) Immunoreactivity is observed in hyperplastic type II pneumocytes and macrophages (Anti-SARS-CoV-2 nuclear protein, 200x). Note (B): blue circles, oral swabs; red circle, rectal swabs. Size bar is 100um.