Figures & data
Table 1. Hepatitis E virus strains used in the study.
Figure 1. Phylogenetic analysis of the strains used to infect rabbits. (A) Phylogenetic analysis of the eight strains based on a partial nucleotide sequence about 350 bp of the ORF2 region. (B) Phylogenetic analysis of nearly complete sequences of five strains (HEV-3ra, hHEV-4d, sHEV-4d, sHEV-4h and HEV8). The complete or nearly complete sequences of the above five virus strains used in the study were obtained. Sixty-six ICTV proposed reference strains were used and the GenBank accession numbers of all reference sequences are shown in the figure. The phylogenetic trees were constructed by the neighbour-joining method. Numbers indicate nodes where bootstrap support was >80% out of 1000 replicates. Bar: nucleotide sequence distances; Dots: strains used to infect rabbits in the study. GenBank numbers: hHEV-3b, MF996356; hHEV-4a, KP325707; hHEV-4d, MT993748; hHEV-4h, KP325697; sHEV-4d, MT993749; sHEV-4h, MT993750; HEV-3ra, JX109834; HEV8, MH410174.
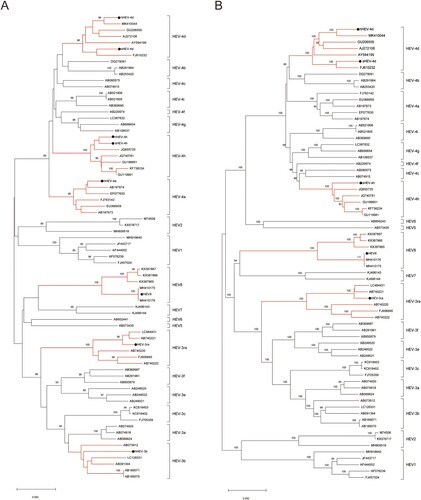
Table 2. Infectivity of different HEV genotypes/subtypes in rabbits.
Figure 2. Duration of fecal virus shedding and fecal viral load in Group B, C and F. (A–D) Duration of fecal virus shedding determined by RT-nPCR results among group B, C and F. (E) Fecal viral load quantified by RT-qPCR results among group B, C and F. Limit of detection showed in dotted line.
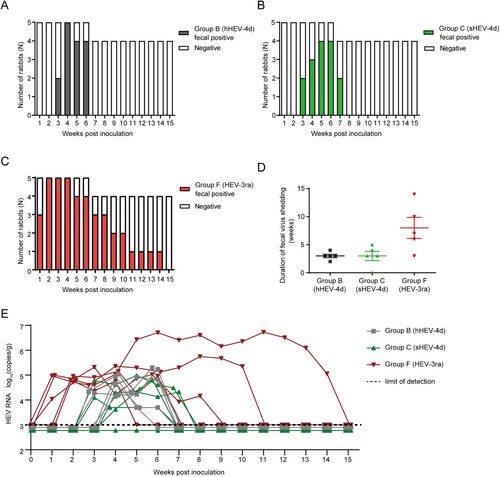
Figure 3. Immunofluorescence staining of HEV ORF2 in liver tissues. Positive signals of ORF2 were observed in liver section in successfully infected group B, C and F. No obvious positive signals were observed in group A, D, E and Control group I. Original magnification, ×20; HEV ORF2 antigen was stained with HEV ORF2-specific antibody in green; nuclei were stained with DAPI in blue.
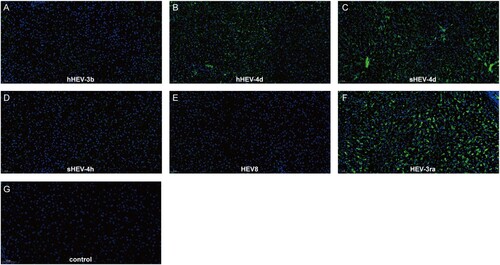
Figure 4. Kinetics of fecal antigen, serum antigen, anti-HEV antibodies and alanine aminotransferase (ALT) levels. (A) Kinetics of fecal antigen in successfully infected rabbits of group B, C and F. (B) Kinetics of serum antigen in successfully infected rabbits of group B, C and F. (C) Dynamic anti-HEV antibody positivity in group A–I. S/CO, signal/cut-off, S/CO = 1 showed in dotted line, S/CO > 1 was positive (D) Dynamic ALT changes in group A–I.
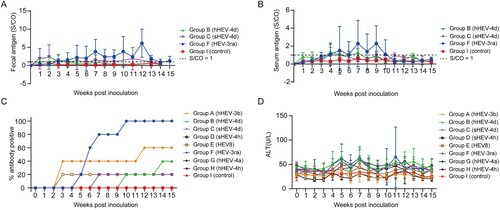
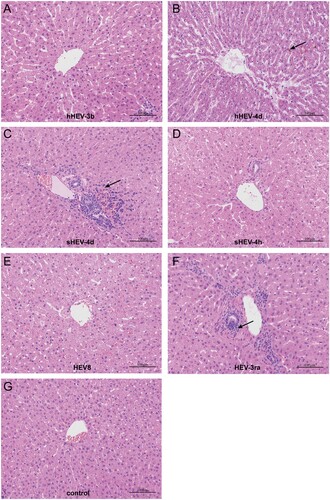
Figure 5. Histopathology of liver tissues. Disordered structure of liver tissues and infiltration of inflammatory cells were observed in liver sections of infected rabbits in group B, C and F. Mild cholestasis was also observed in group B. No obvious pathological changes were seen in group A, D, E and negative group I. Arrows indicate infiltration of inflammatory cells and cholestasis. Original magnification, ×10.