
Figures & data
Figure 1. EspC stimulation induces ER stress-mediated apoptosis. (A, B, C) RAW264.7 cells were treated with 5 µg/mL EspC recombinant protein for various durations (A, B) or different concentrations of EspC for 24 h (C). Next, the cells were collected and subjected to flow cytometry analysis. (D, E) RAW264.7 cells were incubated with 5 µg/mL EspC, proteinase K- or heat-treated EspC (5 µg/mL), proteinase K alone, and LPS for 30 h. Cells were collected, and apoptosis was analyzed using flow cytometry and western blot. (F, G) RAW264.7 cells were incubated with 5 µg/mL EspC or Ag85A for 30 h. Cells were collected, and apoptosis was analyzed using flow cytometry and western blot. (H) Real-Time PCR analysis of the indicated genes in EspC or Ag85A (5 µg/mL)-treated RAW264.7 cells. (I) Immunoblot analysis of CHOP, Bip, p-eIF2α, PERK, p-PERK, and α-tubulin (α-tub1) in the lysates of RAW264.7 cells stimulated with EspC or Ag85A (5 µg/mL) for 0–24 h in a time-dependent manner. (J) RAW264.7 cells were treated with EspC or Ag85A (5 µg/mL) for varying durations, and cell lysates were examined using western blot analysis with antibodies against caspase-12 (Cap-12), caspase-9 (Cap-9), caspase-3 (Cap-3), and α-tub1. (K, L) RAW264.7 cells were pretreated with Z-VAD-fmk for 1 h following EspC or Ag85A stimulation for 24 h. (K) Total cell lysates were analyzed using western blot analysis with antibodies against each target protein. (L) Cells were collected and subjected to flow cytometry for apoptosis analysis. (M, N) RAW264.7 cells were pre-incubated with 4-PBA for 1 h followed by EspC stimulation for 24 h. (M) Total cell lysates were analyzed using western blot analysis with antibodies against each target protein. (N) Cells were collected and subjected to flow cytometry for apoptosis analysis. Ag85A and TG were used as the unrelated negative and positive controls, respectively. LPS treatment was used as the positive control to induce ER stress. Data are shown as the mean ± SEM (n = 3); * p < 0.05, ** p < 0.01, *** p < 0.001.
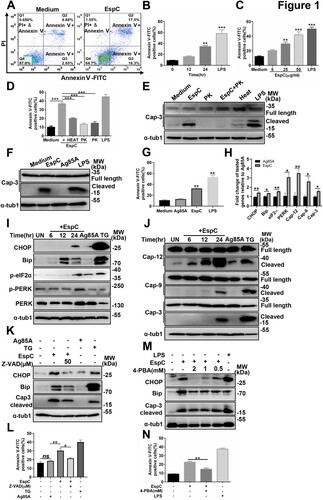
Figure 2. EspC-mediated ER stress is associated with the generation of pro-inflammatory cytokines. (A–C) RAW264.7 cells were pretreated with the IKK-2 inhibitor IKK-2 IV for 1 h before EspC stimulation. (A) The levels of pro-inflammatory cytokines (TNFα, IL-6, MCP-1) in the supernatant were measured using ELISA. (B) Cells were harvested, and total cell lysates were subjected to western blotting for each target protein. (C) The collected cells were subjected to flow cytometry to determine apoptosis after 30-h incubation with EspC (5 µg/mL). (D–F) RAW264.7 cells were pretreated with specific inhibitors—SB203580 (D), SP600125 (E), and U0126 (F)—for 1 h following EspC stimulation for 24 h, and then, the percentage of apoptotic cells was analyzed using flow cytometry. (G) Immunoblot analysis of CHOP, Bip, and α-tub1 in EspC-stimulated RAW264.7 cells pre-incubated with pharmacological inhibitors, p38 (SB203580; 10 µM), JNK (SP600125; 25 µM), and ERK (U0126; 10 µM), for 1 h. (H) MAPK pathway activation in EspC-treated RAW264.7 cells in the presence or absence of SB203580. (I) RAW264.7 cells were pretreated with 4-PBA for 1 h before EspC stimulation, and the levels of pro-inflammatory cytokines (TNFα, IL-6, MCP-1) in the supernatant were measured using ELISA. LPS treatment was used as the positive control to induce ER stress. Data are shown as the mean ± SEM (n = 3); * p < 0.05, ** p < 0.01, *** p < 0.001.
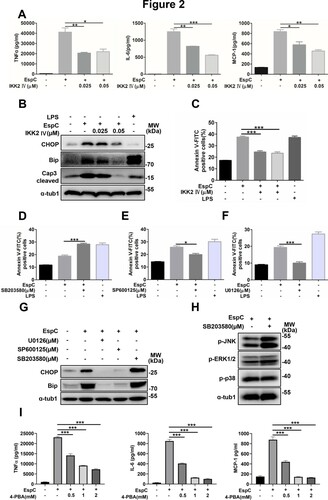
Figure 3. EspC-stimulated increase in intracellular Ca2+ levels is important in the ER stress response. (A–C) RAW264.7 cells were stimulated with EspC or Ag85A for 24 h (A); or RAW264.7 cells were pretreated with or without 4-PBA or BAPTA-AM for 1 h, followed by EspC stimulation for 30 h (B, C). The percentage of increase in intracellular Ca2+ levels was measured with fluo-3/AM using flow cytometry. (D–F) RAW264.7 cells were pretreated with BAPTA-AM for 1 h following incubation with EspC for 30 h. (D) Total cell lysates were examined using western blot analysis with specific antibodies against each target protein. (E) Cells were harvested for apoptosis analysis using flow cytometry. (F) The levels of pro-inflammatory cytokines (TNFα, IL-6, MCP-1) in the supernatant were detected using ELISA. LPS treatment was used as the positive control to induce ER stress. Data are shown as the mean ± SEM (n = 3); * p < 0.05, ** p < 0.01, *** p < 0.001.
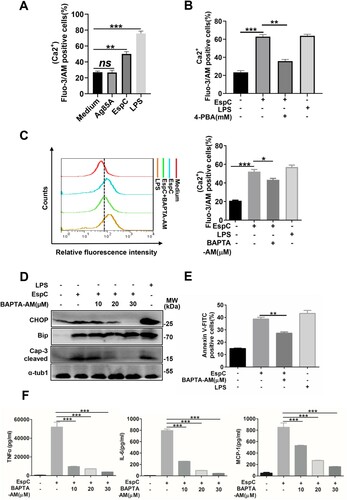
Figure 4. EspC-mediated ER stress is associated with ROS production. (A, B) Intracellular hydrogen peroxide (A) and superoxide (B) levels were evaluated using flow cytometry with DCFH-DA (10 µM) for hydrogen peroxide and dihydroethidium (DHE; 20 µM) for superoxide, after treatment with EspC or Ag85A for 24 h. LPS treatment was used as the positive control. (C) RAW264.7 cells were pretreated with 4-PBA (2 mM) for 1 h and then incubated with EspC for 30 h. Cells were collected and stained with DHE, following which superoxide production was detected using flow cytometry. (D–G) RAW264.7 cells were pretreated with NAC (5, 10 µM) for 1 h and then incubated with EspC for 30 h. (D) Cells were collected and stained with DHE, following which superoxide production was detected using flow cytometry. (E) Total cell lysates were subjected to western blot analysis with specific antibodies against each target protein. (F) Apoptotic cells were quantified using flow cytometry. (G) Pro-inflammatory cytokine (TNFα, IL-6, MCP-1) levels in the supernatant were measured using ELISA. (H) RAW264.7 cells were pretreated with NAC (10 µM) for 1 h and then incubated with EspC for 24 h. Total cell lysates were subjected to western blot analysis with specific antibodies against each target protein. (I) RAW264.7 cells were pretreated with BAPTA-AM (5 µM) for 1 h and then incubated with EspC (5 µg/mL) for 24 h. Cells were collected and stained with DHE, and superoxide production was detected using flow cytometry. (J) RAW264.7 cells were preincubated with or without NAC (10 µM) for 1 h, followed by EspC treatment for 30 h. The percentage of intracellular Ca2+ was measured with fluo-3/AM using flow cytometry. LPS treatment was used as the positive control to induce ER stress. Data are shown as the mean ± SEM (n = 3); * p < 0.05, ** p < 0.01, *** p < 0.001.
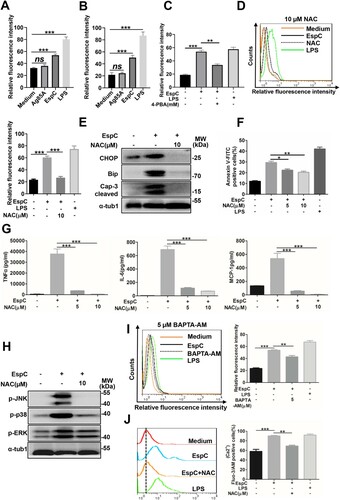
Figure 5. EspC-induced ER stress response is involved in mitochondrial apoptosis. (A-C) RAW264.7 cells were treated with PBS, EspC, or Ag85A for varying durations or 36 h. Cells were collected and stained with DiOC6 (10 nM), and ΔΨm was evaluated using flow cytometry (D) RAW264.7 cells were stimulated with EspC (5 µg/mL) or Ag85A for 24 h, and the expression levels of Bax and cytochrome c were analyzed using qPCR. (E) RAW264.7 cells were stimulated with EspC, Ag85A (5 µg/mL), or PBS for 36 h. Subcellular fractions of the mitochondria and cytoplasm were extracted and analyzed using western blot analysis with antibodies against Bax, cytochrome c (Cyt C), COX IV, and α-tub1. COX IV and α-tub1 were used as markers of mitochondrial and cytosolic fractions, respectively. (F) Representative confocal laser scanning microscopy images showing the Bax translocation from the cytosol into the mitochondria and the Cyt C release from the mitochondria to the cytosol in EspC-stimulated RAW264.7 cells. Scale bar = 5 µm or 2.5 µm. (G) RAW264.7 cells were pretreated with 4-PBA (2 mM) for 1 h and incubated with EspC for 36 h. Subcellular fractions of the mitochondria and cytoplasm were extracted and analyzed using western blot analysis with antibodies against Bax, cytochrome c (Cyt C), COX IV, and α-tub1. Data are shown as the mean ± SEM (n = 3); * p < 0.05, *** p < 0.001.
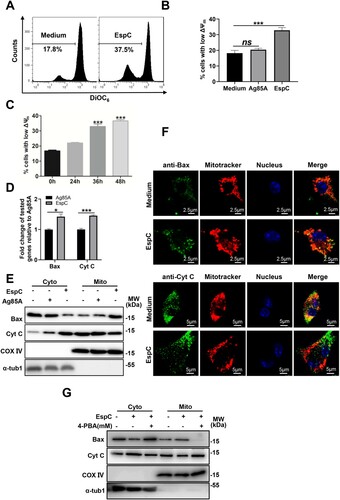
Figure 6. Expression of Mtb EspC in non-pathogenic Msm enhances ER stress-mediated apoptosis. (A) The indicated strains were cultured in Sauton’s medium containing 30 µg/mL kanamycin for 12 h, and the bacteria and cell-culture supernatant were harvested for western blot analysis using anti-His, anti-KatG, and anti-GroES antibodies. Ms::esat-6 expressing and secreting ESAT-6 was used as the positive control. CL: supernatants of bacterial sonicated lysates; CF: cell culture filtrates. (B) Ms::espC were performed on fractionation experiments, and the isolated fractions were subjected to western blotting analysis using anti-His, anti-Ag85, and anti-GroEL1 antibodies. WCL: whole-cell lysates; CW: cell-wall fractions; CM: cell-membrane fractions; CP: cytoplasmic fraction. Cell wall Ag85 and cytoplasmic GroEL1 were used as the positive and negative controls, respectively. (C–I) RAW264.7 cells were infected with the indicated mycobacterial strains for the indicated durations at MOI = 10. (C) Apoptotic cells were quantified using flow cytometry. (D) The expression level of each target gene was analyzed using qPCR. (E-G) Total cell lysates were examined using western blot analysis with specific antibodies against each target protein. (H) Cells were collected and stained with DiOC6 (10 nM), and ΔΨm was evaluated using flow cytometry. (I) The expression levels of Bax and cytochrome c were determined using qPCR. (J) RAW264.7 cells were infected with the indicated mycobacterial strains for the indicated durations at MOI = 10 in the presence or absence 4-PBA. Subcellular fractions of the mitochondria and cytoplasm were extracted and analyzed using western blot analysis with antibodies against each target protein. Data are shown as the mean ± SEM (n = 3); * p < 0.05, ** p < 0.01, *** p < 0.001.
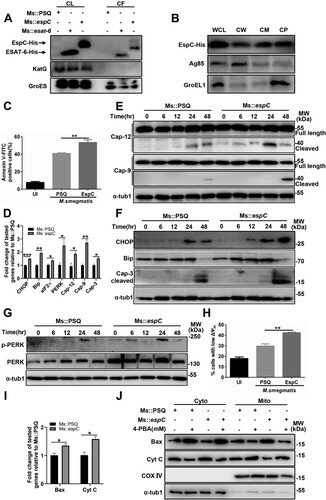
Figure 7. EspC induces ER stress and apoptosis and promotes mycobacterial infection in mice. (A) Intracellular survival of Msm in RAW264.7 cells infected with Ms::PSQ and Ms::espC at MOI = 10 for the indicated time in the absence or presence of Z-VAD (50 µM). (B, C) C57BL/6 mice were challenged with Ms::PSQ or Ms::espC (1 × 10⁶ CFU/mouse), and CFUs were counted in the spleens (B) and lungs (C) of the infected mice at 8 h, and days 2, 4, and 6 post-infection. (D) Survival of WT C57BL/6 mice after infection with Ms::PSQ or Ms::espC (1 × 10⁷ CFU/mouse) administered via i.v. injection (* p < 0.05, Gehan–Breslow–Wilcoxon Test). (E) C57BL/6 mice were challenged with Ms::PSQ or Ms::espC (1 × 10⁶ CFU/mouse), and hematoxylin and eosin (HE) staining was performed in the spleen tissues of infected mice at indicated times at 8 h, and days 2, 4, and 6 post-infection. Scale bar = 100 µm. (F–H) Immunostaining of CHOP (F), Bip (G), and cleaved caspase-3 (H) was performed on the spleen tissues of infected mice. Scale bar = 100 µm or 10 µm. The bar plot shows the CHOP, Bip, or cleaved caspase-3 intensity (mean optical density) in the spleen. Data are shown as the mean ± SEM (n = 3); * p < 0.05, ** p < 0.01, *** p < 0.001.
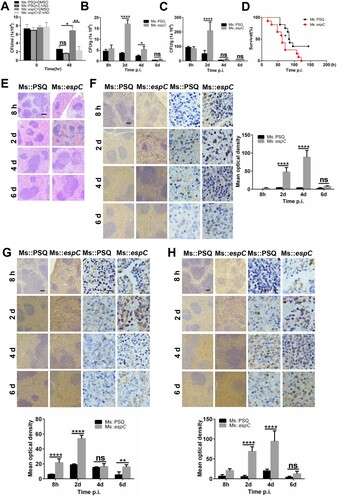
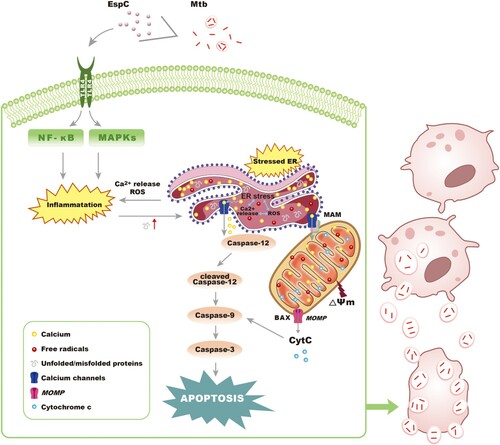
Figure 8. Proposed mode of action of Mtb EspC. Mtb EspC-induced pro-inflammatory cytokine overload through MAPK/ NF-κB cascades initiates the ER stress response, leading to intracellular calcium disturbance and ROS generation. This subsequently results in the generation of more pro-inflammatory cytokines, thus aggravating the ER stress. The cross-talk and interactions among ER stress, intracellular calcium fluctuations, ROS production, and pro-inflammatory cytokine overload trigger a sustained ER stress response and eventually cause apoptosis, which might promote mycobacterial infection. MOMP, mitochondrial outer membrane permeabilization; MAM, mitochondrial associated membrane.
Table_S2_final.xlsx
Download MS Excel (38.9 KB)Table_S1_final.xlsx
Download MS Excel (1.5 MB)Supplementary_Materials__For_Revision_final.docx
Download MS Word (5.6 MB)Data availability statement
Data are available via ProteomeXchange with identifier PXD013666.