
Figures & data
Figure 1. RNA detection of SARS-CoV-2. The horizontal axis represents the sampling date. Nasal swabs (circle), faecal samples (diamond), and sputum (triangle) samples are coloured per individual. Negative samples are illustrated as Ct 41 (below the dotted line). Arrows with the corresponding caption colours indicate the day of symptom onset and the date of the SARS-CoV-2 diagnosis of humans.
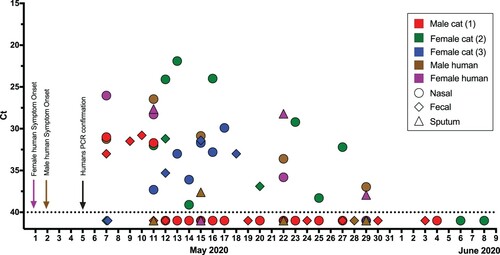
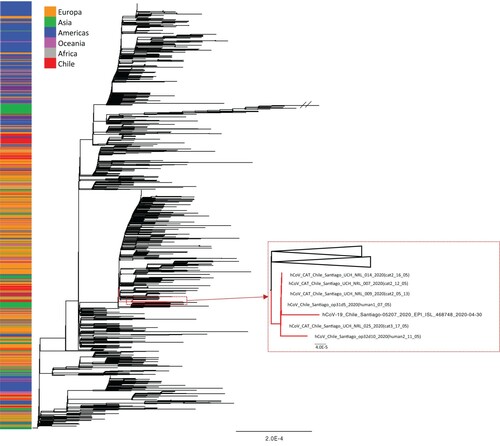
Figure 2. Phylogenetic tree estimated with the all available Chilean SARS-CoV-2 sequences and a random sample of available background sequences. Near to complete genome sequences of cat 2 (n=3), cat 3 (n=1), and both owners formed a monophyletic group. An additional human sequence collected in the same time period and area similarly fell into this cluster. The phylogeny was estimated using the maximum likelihood method available in IQ-TREE v1.6.7 employing the GTR + F+I+Γ4 model of nucleotide substitution with 1000 bootstrap replications.
Suplementary_Information_1_fnal.xlsx
Download MS Excel (22.3 KB)Supplementary_Information_2.pdf
Download PDF (48.4 KB)Data availability
Sequences that support the results of this study have been deposited at GenBank with accession numbers (MW064259-MW064264). Animal testing results are detailed in supplementary information.