
Figures & data
Table 1. Data collection and refinement statistics.
Figure 1. Organization of the PDCoV nsp3 genome and the overall structure of PDCoV Macro-Ubl2-PLpro. (A) Arrangement of the different functional subdomains of PDCoV nsp3: Ubl, ubiquitin-like domain 1; HVR, hypervariable region; Macro, macrodomain; Ubl2, ubiquitin-like domain 2; PLpro, papain-like protease domain; TM1 and TM2, transmembrane regions 1 and 2; 3Ecto, nsp3 ectodomain; Y1 and CoV-Y, Y1 and CoV-Y domain. The constructed regions used in the assay are highlighted in pink; the organization of the PDCoV Macro-Ubl2-PLpro domains was inferred from the crystal structure. (B) Ribbon representations of the subunits of the PDCoV Macro-Ubl2-PLpro structure. Secondary structures (helices, strands and loops) are marked; α-helices are labelled from α1 to α12, β-stands are labelled from β1 to β20, and Zn2+ ions are shown as a red sphere. In A and B, the domains are coloured in the same manner.
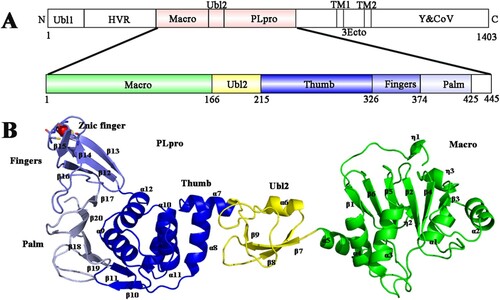
Figure 2. Structural comparison and topology diagram of Macros among the four CoV genera. (A)–(D) Detailed structures of PDCoV Macro from δ-CoV (green), FCoV Macro from α-CoV (orange), SARS-CoV Macro from β-CoV (salmon), and IBV Macro from γ-CoV (cyan). From A to D, secondary structures (helices, strands, and loops) are marked. (E)–(G) Topology diagrams of PDCoV Macro from δ-CoV, FCoV Macro from α-CoV (orange), SARS-CoV Macro from β-CoV (salmon), and IBV Macro from γ-CoV (cyan). From E to G, the β-strands are shown as arrows, and the α-helices and 310-helices (η) are drawn as cylinders. Coronavirus macrodomains have a very similar topology. The differences in the topologies are coloured (red in PDCoV, blue in FCOV and SARS-CoV, and magenta in SARS-CoV). The PBD IDs of FCoV, SARS-CoV and IBV Macros are 3ETI, 2ACF and 3EWP, respectively.
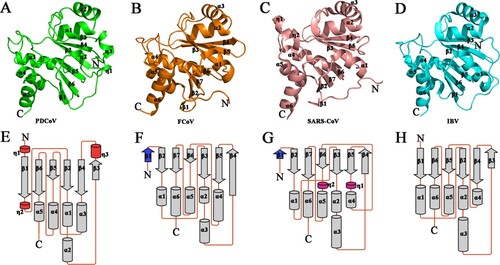
Figure 3. Structural comparison of PLPs among four CoVs. (A) Detailed structure of PDCoV PLpro from δ-CoV (blue). (B) Structure of SARS-CoV PLpro from β-CoV (PDB ID: 2FE8, salmon[Citation27]). (C) Structure of MERS-CoV PLpro from β-CoV (PDB ID: 4RNA, magenta [Citation60]). (D) Structure of IBV PLpro from γ-CoV (PDB ID: 4X2Z, cyan [Citation24]). From A to D, the secondary structures (helices, strands, and loops) are marked; Zn2+ ions are shown as spheres. Regions that show significant differences among genera are indicated by arrows.
![Figure 3. Structural comparison of PLPs among four CoVs. (A) Detailed structure of PDCoV PLpro from δ-CoV (blue). (B) Structure of SARS-CoV PLpro from β-CoV (PDB ID: 2FE8, salmon[Citation27]). (C) Structure of MERS-CoV PLpro from β-CoV (PDB ID: 4RNA, magenta [Citation60]). (D) Structure of IBV PLpro from γ-CoV (PDB ID: 4X2Z, cyan [Citation24]). From A to D, the secondary structures (helices, strands, and loops) are marked; Zn2+ ions are shown as spheres. Regions that show significant differences among genera are indicated by arrows.](/cms/asset/b10d6e19-ffce-4d0a-814b-c9ab1f57a162/temi_a_1865840_f0003_oc.jpg)
Figure 4. Structural comparison of Ubl2 from three CoV genera. (A) Detailed structure of PDCoV Ubl2 from δ-CoV (yellow). (B) Structure of SARS-CoV PLpro from β-CoV (PDB ID: 2fe8, salmon). (C) Structure of IBV PLpro from γ-CoV (PDB ID: 4×2z, cyan). From A to C, secondary structures (helices, strands and loops) are marked. (D) and (E) Crystal structures of SARS-CoV Ubl2-PLpro (PDB ID: 2fe8, salmon) and MHV DPUP-Ubl2-PLP2 (PDB ID: 4ypt, warm pink) are superimposed over the structure of PDCoV Macro-Ubl2-PLpro (in multiple colours). Macro of PDCoV, the DPUP (domain preceding Ubl2 and PLP2) of MHV and the PLPs from PDCoV and SARS-CoV are shown as ribbons, and MHV, Ubl2 from PDCoV, SARS-CoV and MHV are shown as cartoons. The deviation angles of Ubl2 are within the black lines.
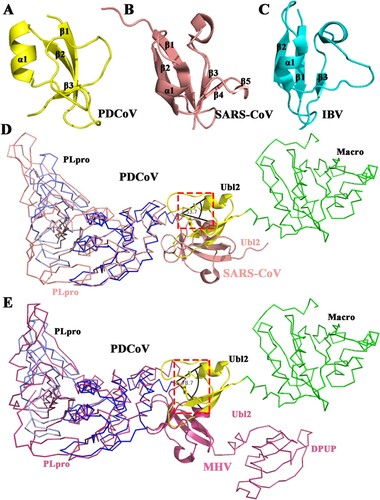
Table 2. Apparent kcat/Km (kapp) values for PDCoV PLpro.
Figure 5. In vitro activity assays of PDCoV Macro-Ubl2-PLpro and truncated protein. (A) PDCoV Macro-Ubl2-PLpro and truncated constructs. (B) The hydrolytic activity assay was performed with 2 µM enzyme and 40 µM FRET peptides. The Macro-Ubl2-PLpro fluorescence intensity value was set to 100%. (C) The deubiquitinating activity assay was determined with 1 µM enzyme and 0.4 µM Ub-AMC. (D) The deISGylating activity assay was determined with 1 µM enzyme and 0.4 µM ISG15-AMC. Experiments were performed in triplicate, the wild-type fluorescence intensity value was set to 100%. The error bars represent the standard deviations for a minimum of triplicate samples. Asterisks indicate statistical significance calculated using unpaired two-tailed student’s t-test, and values of 0.05 were considered statistically significant. *p < 0.05; **p < 0.01; ***p < 0.001.
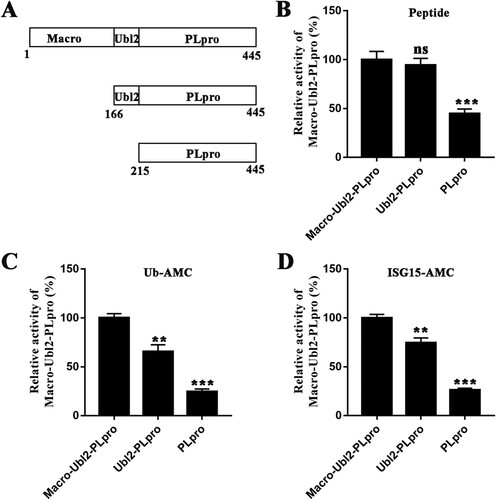
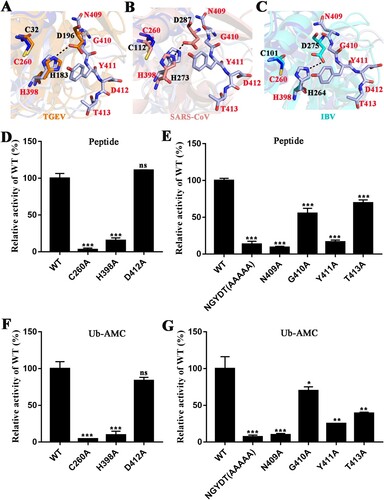
Figure 6. Active sites in PDCoV PLpro. (A) Superposition of catalytic residues of PDCoV PLpro (blue and light blue) and TGEV PLP1 (PDB ID: 3MP2, orange sticks). (B) Superposition of catalytic residues of PDCoV PLpro (blue and light blue) and SARS-CoV PLpro from β-CoV (PDB ID: 2FE8, salmon sticks). (C) Superposition of catalytic residues of PDCoV PLpro (blue and light blue sticks) and IBV PLpro (PDB ID: 4X2Z, cyan sticks). From A to C, C260 and H398 residues are the catalytic residues of PDCoV PLpro; N409, G410, Y411, D412 and T413 residues are the composition of the key motif. The distance between His and Asp in TGEV PLP1, SARS-CoV PLpro and IBV PLpro is indicated with black dashed lines. (D) and (E) The relative enzyme activities of PDCoV Macro-Ubl2-PLpro (WT) and mutants. The hydrolytic activity assays were performed with 2 µM enzyme and 40 µM FRET peptides as described in the Materials and Methods. The wild-type fluorescence intensity value was set to 100%. (F) and (G) The deubiquitinating activity assay was determined with 1 µM enzyme and 0.4 µM Ub-AMC. Experiments were performed in triplicate, the wild-type fluorescence intensity value was set to 100%. The error bars represent the standard deviations for a minimum of triplicate samples. Asterisks indicate statistical significance calculated by unpaired two-tailed student’s t-test, values of 0.05 were considered statistically significant. *p < 0.05; **p < 0.01; ***p < 0.001.
Supplementary_materials-1.docx
Download MS Word (3.6 MB)Data availability
The coordinates and structural characteristics of PDCoV Macro-Ubl2-PLpro were submitted to the Research Collaboratory for Structural Bioinformatics (RCSB) under PDB accession number 6LNO.