
Figures & data
Figure 1. Survival of 6-week-old SPF chickens (blue), Pekin ducks (orange) and Eurasian (EA) wigeons (green) after intratracheal/intranasal infection (doses 105.3 EID50/bird) with (A) H5N8-2014, (B) H5N8-2016, and (C) H5N6-2017 viruses. Per group 10 birds were monitored for 10 days for clinical symptoms and mortality. The pathogenicity score was calculated based on OIE criteria for IVPI, and ranges from 0.0 (no pathogenicity) to 3.0 (highest pathogenicity). The pathogenicity scores for the viruses are listed in the legend.
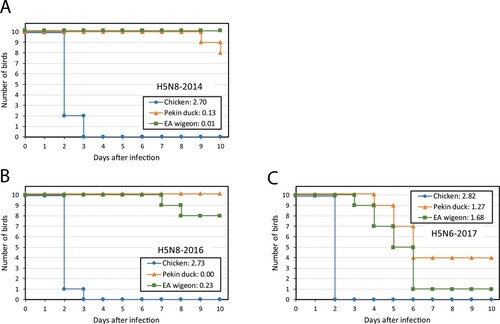
Figure 2. Mean virus shedding (log10 EID50/ml) after infection with (A) H5N8-2014, (B) H5N8-2016, and (C) H5N6-2017 viruses. Virus shedding was measured in oropharyngeal (OP) and cloacal (CL) swabs collected from chickens (blue), Pekin ducks (orange), and Eurasian (EA) wigeons (orange) during 10 days after infection. The detection limit of 1.7 log10 EID50/ml is marked by a black line.
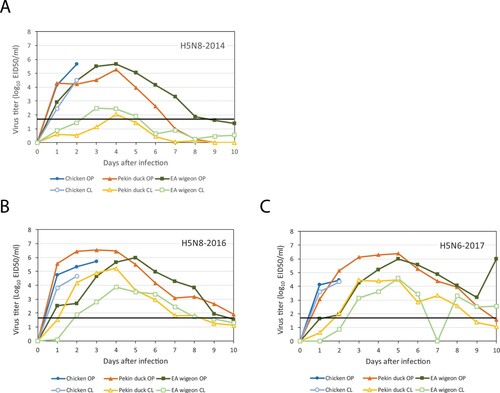
Table 1. Virus shedding of HPAI infected birds.
Figure 3. Survival of 6-week-old chickens after exposure to water (blue line) or bedding material (orange line) contaminated by Eurasian wigeons infected with H5N8-2016 virus.
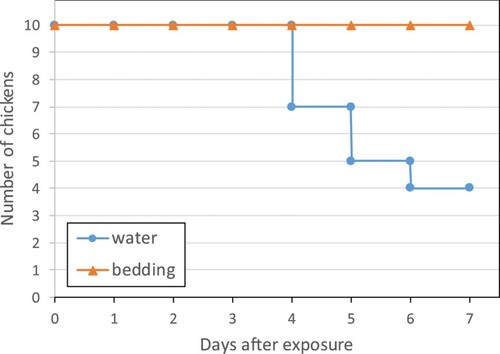
Figure 4. Virus shedding of chickens exposed to contaminated water (w1–w10) for 7 days, measured in (A) oropharyngeal (OP) swabs and (B) cloacal (CL) swabs.
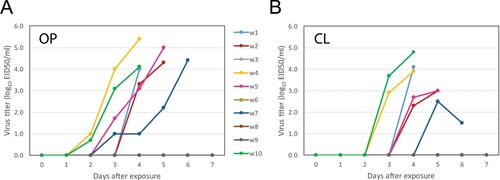
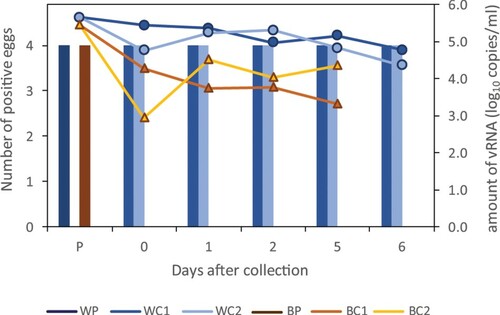
Figure 5. Persistence of virus in water and bedding material in the two control cages. The viability of the virus was tested by inoculation into four embryonated eggs (columns), and the amount of viral RNA was determined by real-time RT-PCR (line graph). Samples of water and bedding material were tested pre-collection (P) in the pen housing the Eurasian wigeons, and at days 0, 1, 2, and 5 of the environmental transmission experiment. Water samples were also tested on day 6. WP: water pre-collection, WC1: water control cage 1, WC2: water control cage 2, BP: bedding pre-collection BC1: bedding control cage 1, BC2: bedding control cage 2.