
Figures & data
Figure 1. Analysis of PcATP2 expression in S. cerevisiae membranes, alone or co-expressed with each of the three putative PcCdc50 subunits. 5 µg of total protein were loaded on each lane. Top panels, western blots revealed with the probe against the BAD tag. Bottom panels, western blots revealed with the HisProbeTM to detect the 10xHis tag. Gel bands corresponding to PcATP2 and the P. chabaudi Cdc50 subunits are indicated by arrows. Lane 1: single expression of PcATP2-BAD. Lane 2: single expression of BAD-PcATP2. Lane 3: co-expression of PcATP2-BAD and PcCdc50B-His. Lane 4: co-expression of BAD-PcATP2 and PcCdc50B-His. Lane 5: co-expression of PcATP2-BAD and PcCdc50C-His. Lane 6: co-expression of BAD-PcATP2 and PcCdc50C-His. Lane 7: co-expression of PcATP2-BAD and PcCdc50A-His. Lane 8: co-expression of BAD-PcATP2 and PcCdc50A-His. Lane 9: empty Vector, membranes expressing no Plasmodium proteins (negative control). The theoretical molecular weight mass of PcATP2-BAD or BAD-PcATP2 is 180 kDa. The theoretical molecular weight masses of PcCdc50B-His, PcCdc50C-His and PcCdc50A-His are, respectively, 45, 61 and 51 kDa. Lanes 1–6 were run in a 8% acrylamide gel. Lanes 7–9 were run in a gel containing a gradient of acrylamide between 4–15%. Naturally occurring biotinylated S. cerevisiae proteins are indicated in lane 9: Acc1p, acetyl-CoA carboxylase; Dur 1/2p, urea carboxylase; Pyc 1/2p, pyruvate carboxylase isoforms 1 and 2, and Arc 1p, complex acyl-RNA[Citation40].
![Figure 1. Analysis of PcATP2 expression in S. cerevisiae membranes, alone or co-expressed with each of the three putative PcCdc50 subunits. 5 µg of total protein were loaded on each lane. Top panels, western blots revealed with the probe against the BAD tag. Bottom panels, western blots revealed with the HisProbeTM to detect the 10xHis tag. Gel bands corresponding to PcATP2 and the P. chabaudi Cdc50 subunits are indicated by arrows. Lane 1: single expression of PcATP2-BAD. Lane 2: single expression of BAD-PcATP2. Lane 3: co-expression of PcATP2-BAD and PcCdc50B-His. Lane 4: co-expression of BAD-PcATP2 and PcCdc50B-His. Lane 5: co-expression of PcATP2-BAD and PcCdc50C-His. Lane 6: co-expression of BAD-PcATP2 and PcCdc50C-His. Lane 7: co-expression of PcATP2-BAD and PcCdc50A-His. Lane 8: co-expression of BAD-PcATP2 and PcCdc50A-His. Lane 9: empty Vector, membranes expressing no Plasmodium proteins (negative control). The theoretical molecular weight mass of PcATP2-BAD or BAD-PcATP2 is 180 kDa. The theoretical molecular weight masses of PcCdc50B-His, PcCdc50C-His and PcCdc50A-His are, respectively, 45, 61 and 51 kDa. Lanes 1–6 were run in a 8% acrylamide gel. Lanes 7–9 were run in a gel containing a gradient of acrylamide between 4–15%. Naturally occurring biotinylated S. cerevisiae proteins are indicated in lane 9: Acc1p, acetyl-CoA carboxylase; Dur 1/2p, urea carboxylase; Pyc 1/2p, pyruvate carboxylase isoforms 1 and 2, and Arc 1p, complex acyl-RNA[Citation40].](/cms/asset/517a96c8-9010-44d6-8e4e-ec7f33abcf0f/temi_a_1870413_f0001_ob.jpg)
Figure 2. Analysis of membrane fractions of S. cerevisiae co-expressing PcATP2 with either PcCdc50B or PcCdc50A. Top panels, western blots revealed with the probe against the BAD. Bottom panels, western blots revealed with the HisProbeTM to detect the 10xHis tag. (A) membrane fraction co-expressing BAD-PcATP2 and PcCdc50B-His. (B) membrane fraction co-expressing BAD-PcATP2 and PcCdc50A-His. The bands corresponding to BAD-PcATP2, PcCdc50B-His and PcCdc50A-His are indicated. P2 and S2 are, respectively, the membrane pellet and the supernatant obtained after centrifugation at 20,000 × g. P3 and S3 are, respectively, the membrane pellet and the supernatant obtained after centrifugation at 125,000 × g. Each lane was loaded with the corresponding membrane fraction or supernatant containing 1 µg of total protein. Biotinylated S. cerevisiae proteins are also indicated: Acc1p: acetyl-CoA carboxylase, Dur1/2p: urea carboxylase, and Pyc1/2p: pyruvate carboxylase isoforms 1 and 2[Citation40].
![Figure 2. Analysis of membrane fractions of S. cerevisiae co-expressing PcATP2 with either PcCdc50B or PcCdc50A. Top panels, western blots revealed with the probe against the BAD. Bottom panels, western blots revealed with the HisProbeTM to detect the 10xHis tag. (A) membrane fraction co-expressing BAD-PcATP2 and PcCdc50B-His. (B) membrane fraction co-expressing BAD-PcATP2 and PcCdc50A-His. The bands corresponding to BAD-PcATP2, PcCdc50B-His and PcCdc50A-His are indicated. P2 and S2 are, respectively, the membrane pellet and the supernatant obtained after centrifugation at 20,000 × g. P3 and S3 are, respectively, the membrane pellet and the supernatant obtained after centrifugation at 125,000 × g. Each lane was loaded with the corresponding membrane fraction or supernatant containing 1 µg of total protein. Biotinylated S. cerevisiae proteins are also indicated: Acc1p: acetyl-CoA carboxylase, Dur1/2p: urea carboxylase, and Pyc1/2p: pyruvate carboxylase isoforms 1 and 2[Citation40].](/cms/asset/0ecb675e-f889-4419-9f4c-71f155ea7b64/temi_a_1870413_f0002_ob.jpg)
Figure 3. Deglycosylation assays of PcCdc50B and PcCdc50A co-expressed with PcATP2. Membranes co-expressing PcATP2/PcCdc50B, PcATP2/PcCdc50A or Drs2p/Cdc50p were enzymatically deglycosylated with PNGase F or EndoH, as indicated. 10 µg total protein were loaded in the experiments with PcATP2/PcCdc50B and PcATP2/PcCdc50A, whereas 5 µg of total protein were loaded in the control experiment with Drs2p/Cdc50p. The western blots were revealed with the HisProbeTM to detect the 10xHis tag.
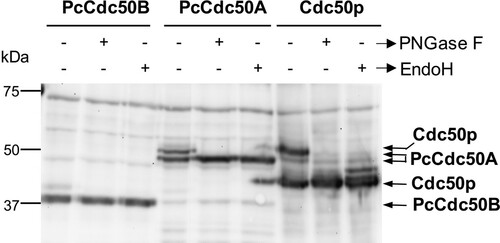
Figure 4. Co-immunoprecipitation of PcATP2-GFP-BAD with PcCdc50B-His or PcCdc50A-His. Lanes 1–4 correspond to the different steps of the assay with membranes co-expressing PcATP2-GFP-BAD and PcCdc50B-His (A) or PcCdc50A-His (B): (1) input, detergent-solubilized membranes, (2) flow-through or non-bound protein fraction, (3) washings, and (4) elution. Lanes 5–8 are equivalent to lanes 1–4 but with membranes co-expressing PcATP2-BAD and either, PcCdc50B-His (A) or PcCdc50A-His (B). The blots on the top panel were revealed with an antibody against the GFP to detect PcATP2-GFP-BAD, and the bottom one with the HisProbeTM to detect PcCdc50B-His and PcCdc50A-His (labelled with an asterisk).
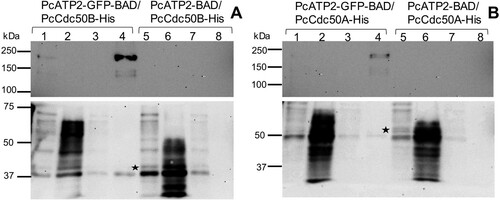
Figure 5. Fluorescence-detection Size Exclusion Chromatography of detergent solubilized PcATP2 and PcCdc50B. Membranes containing 5 mg/ml of total protein concentration were solubilized with 1% (w/v) DDM, 0.2% (w/v) CHS, and the supernatant after ultracentrifugation was loaded into a Superose 6 10/300 GL gel-filtration column equilibrated with 20 mM Tris-HCl pH 7.8, 150 mM NaCl, 10% (v/v) Glycerol, 0.1 mg/mL DDM, 0.02 mg/mL CHS, and connected to a fluorescence detector. Normalized FSEC profiles of single-expression of PcATP2-GFP-BAD (dotted lines) and co-expression of PcATP2-GFP-BAD with PcCdc50B-His (solid line). A profile of membranes expressing no protein is shown (in grey shadow). Normalized FSEC profile of single-expression PcCdc50B-GFP-His (dashed line). The presence of free eGFP is indicated. On top of the figure, analysis of PcCdc50B-His co-elution with PcATP2-GFP-BAD (solid line chromatogram). Collected fractions of 200 µl between 10.4–12 ml of the PcATP2-GFP-BAD elution were analyzed by western blot using the HisProbeTM to detect the presence of PcCdc50B-His.
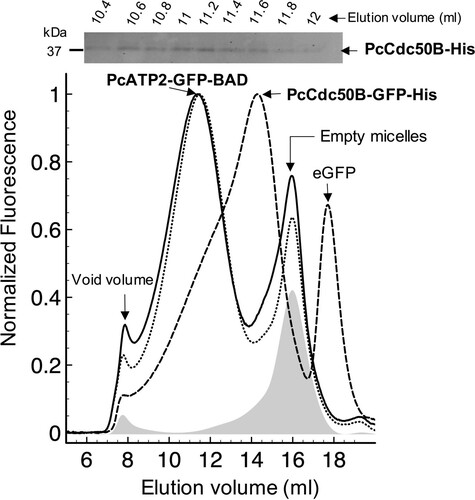
Figure 6. Lipid-stimulated ATPase activity of PcATP2/PcCdc50B complex. The apparent ATPase activity of the PcATP2/PcCdc50B complex was measured by spectrophotometric quantification of the released inorganic phosphate in the absence (no lipid) and in the presence of the indicated lipids. POPS, 1-palmitoyl-2-oleoyl-sn-glycero-3-phospho-L-serine, and POPE, 1-palmitoyl-2-oleoyl-sn-glycero-3-phosphoethanolamine. As indicated, ATPase assays were also performed in the presence (+) or in the absence (-) of phosphatidylinositol-4-phosphate (PI4P). Gray bars and white bars represent, respectively, the activity of the wild-type (WT) and the functionally-impaired D596N mutant (DN) at each experimental condition. The reaction was performed at 37°C during 25 min, and initiated by the addition of 1 mM ATP-Mg2+. The bars display the average value of n = 3 or n = 4 experimental datapoints, and the indicated error is the standard deviation. The upper panel displays the SDS-PAGE of the acid-eluted content of the immobilized wild-type (WT) or D596N mutant (DN) agarose beads used for this experiments. (A) Coomassie-stained, (B) western blot using the antibody against the GFP to detect PcATP2-GFP, and (C) western blot using the HisProbeTM to detect the 10xHis tag fused to PcCdc50B .* P < 0.05 (paired t-test). Note that the DN mutant of PcATP2 runs slightly faster because it lacks the BAD domain.
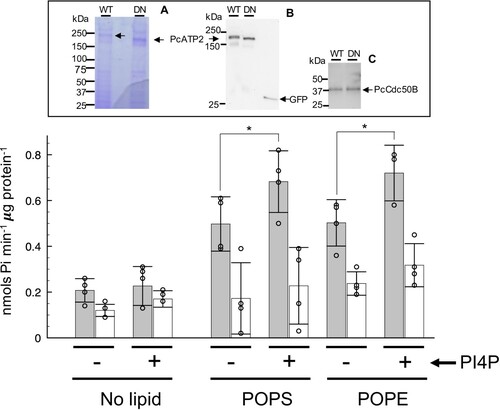
Figure 7. Alignment of the cryo-EM structure of Drs2p and a 3D structural model of PcATP2. The 3D structural model of PcATP2 (cartoon representation) was aligned with the cryo-EM structure of the autoinhibited conformation of Drs2p (PDB ID 6roh, mesh representation [Citation23]). Protein domains of PcATP2 in the cytoplasmic region between TMs 2 and 3 that are absent in Drs2p are depicted in blue. Protein domains of PcATP2 in the cytoplasmic region between TMs 4 and 5 that are absent in Drs2p are depicted in magenta. (A) Lateral perspective of the molecule. (B) Cytoplasmic view after 90° rotation of A through the x axis. The grey shadow square in A represents the putative position of the surrounding membrane.
![Figure 7. Alignment of the cryo-EM structure of Drs2p and a 3D structural model of PcATP2. The 3D structural model of PcATP2 (cartoon representation) was aligned with the cryo-EM structure of the autoinhibited conformation of Drs2p (PDB ID 6roh, mesh representation [Citation23]). Protein domains of PcATP2 in the cytoplasmic region between TMs 2 and 3 that are absent in Drs2p are depicted in blue. Protein domains of PcATP2 in the cytoplasmic region between TMs 4 and 5 that are absent in Drs2p are depicted in magenta. (A) Lateral perspective of the molecule. (B) Cytoplasmic view after 90° rotation of A through the x axis. The grey shadow square in A represents the putative position of the surrounding membrane.](/cms/asset/f4728581-cfe0-4912-922a-64fa30c05f96/temi_a_1870413_f0007_oc.jpg)