Figures & data
Figure 1. Effect of methylprednisolone on SARS-CoV-2 RNA replication and viral induction of cytokine expression in monocyte-derived macrophages. (A) Treatment scheme indicating different time points and doses of methylprednisolone addition before or after SARS-CoV-2 infection at 1 MOI in monocyte-derived macrophages from multiple donors. (B–J) Intracellular viral RNA loads and viral induction of the expression of selected proinflammatory cytokines. Cell lysates were collected at 48 hpi and viral genome copies were detected by RT-qPCR (B, E and H). Relative expression of IL6 (C, F and I) and CXCL10 (D, G and J) was examined by RT-qPCR. Results are presented after normalization to human β-tubulin (β-tub) transcript. Difference between the indicated group and the no treatment group was statistically significant as judged by Student’s t test (*P < 0.05; **P < 0.01; ***P < 0.001).
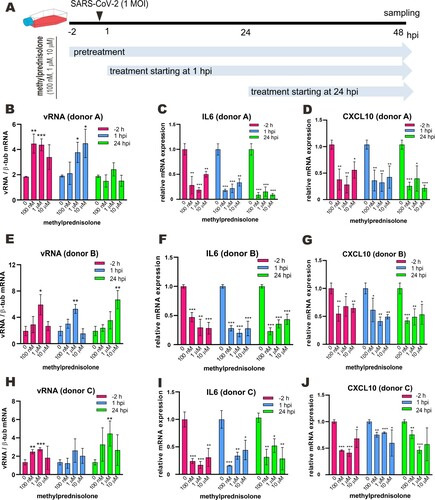
Figure 2. Beneficial effect of methylprednisolone in SARS-CoV-2-infected hamsters. (A) Diagram of the virus challenge scheme. Hamsters (n = 3) were intranasally inoculated with 105 PFU of SARS-CoV-2 and were intraperitoneally (i.p.) given either methylprednisolone (10 mg/kg) or vehicle control (PBS) at 2 dpi (early steroid treatment, ET, pink) or 5 dpi (delayed steroid treatment, DT, blue) for rapid analysis of the impact on viral loads. At 4 dpi or 7 dpi (i.e. 2 days after methylprednisolone injection), respiratory tissue viral yields in the nasal turbinates and lung tissues of the hamsters were detected by RT-qPCR and plaque assay. Alternatively, infected hamsters (n ≥ 3) were intramuscularly (i.m.) injected with either methylprednisolone (10 mg/kg) or PBS at 2 dpi (ET in pink) or 5 dpi (DT in blue) for delayed analysis of the impact on viral loads at 14 dpi. (B) Dynamic changes of body weights of SARS-CoV-2-infected hamsters intramuscularly administered with PBS or methylprednisolone (ET and DT). (C, D) Viral loads by RT-qPCR and plaque assay in the nasal turbinates and lung tissues collected at 4 dpi and 7 dpi from SARS-CoV-2-challenged hamsters intraperitoneally administered with either PBS or methylprednisolone at 2 dpi (ET) and 5 dpi (DT), respectively. (E, F) Viral loads in the nasal turbinates and lung tissues collected at 14 dpi from SARS-CoV-2-challenged hamsters intramuscularly injected at 2 dpi (ET) or 5 dpi (DT). (G) EIA analysis of anti-RBD antibodies in serum samples harvested at 14 dpi from hamsters intramuscularly administered with PBS and steroid (ET and DT).
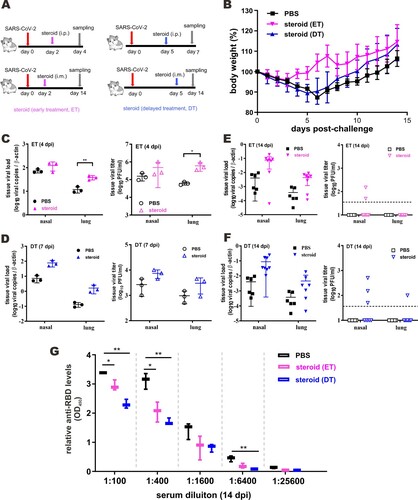
Figure 3. Impact of steroid on the histopathological changes in nasal turbinates and lungs of SARS-CoV-2-infected hamsters. Representative images of nasal turbinate and lung sections of SARS-CoV-2-infected hamsters were shown. Hamsters were intranasally inoculated with 105 PFU of SARS-CoV-2 and then treated with methylprednisolone at 2 dpi (early steroid treatment, ET) or 5 dpi (delayed steroid treatment, DT). Histopathological changes in nasal turbinate and lung tissues were examined by hematoxylin and eosin staining. (A) Images at 4 dpi. Nasal turbinate tissue in PBS treatment control hamster showed severe epithelial desquamation and submucosal infiltration (arrows). The lung tissue showed diffuse alveolar wall thickening, blood vessel congestion, patchy area of alveolar space infiltration, exudation and patchy area of lung consolidation with two adjacent blood vessels showing vasculitis (open arrows). In ET group, respiratory and olfactory epithelium was intact, with mild submucosal infiltration observed in respiratory epithelium (arrows). In the lung tissue, only peribronchiolar infiltration and patchy area of alveolar wall thickening were observed (open arrows). Scale bar, 100 μm. (B) Images at 7 dpi showing histopathological changes in nasal turbinate and lung tissues from hamster receiving DT at 5 dpi. Nasal turbinate of the PBS control still showed some exudation mixed with cell debris in the nasal cavity (arrows), while the nasal epithelium showed prominent cell proliferation in steroid-treated hamster indicating tissue repairment (lower, arrows). Scale bar, 100 μm. The lung of PBS control hamster showed focal hemorrhage and patchy proliferative consolidation (open arrows); while in steroid-treated hamster, the lung still had mild perivascular infiltration but only very small foci of cell proliferation (open arrows). Scale bar, 200 μm. (C) Images at 14 dpi. Nasal turbinate tissue in PBS control hamster still showed mild degree intra-epithelium infiltration and submucosal blood vessel congestion. Luminal secretion with cell debris was occasionally observed (arrows). While nasal turbinate tissues showed intact epithelial layers, no apparent immune cell infiltration or luminal secretion was seen. Scale bar, 100 μm. The lung tissue in PBS control showed diffuse alveolar wall thickening and blood vessel congestion with no alveolar space infiltration or exudation. Upon early (ET) or delayed (DT) steroid treatment, the lung tissue showed only focal area of mild alveolar wall thickening and vessel congestion. Scale bar, 200 μm.
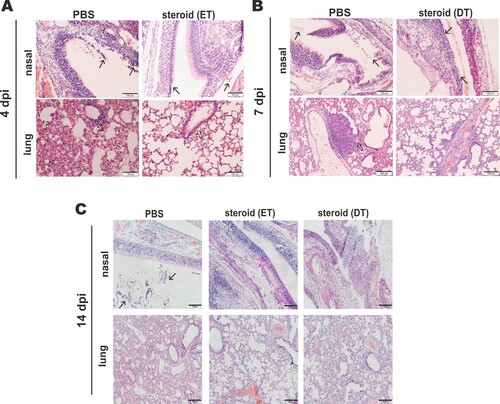
Figure 4. Proinflammatory cytokine and chemokine gene expression in SARS-CoV-2-infected hamster lung upon methylprednisolone treatment. Transcripts of representative chemokines and cytokines in the lung tissue homogenates of the indicated groups were detected by RT-qPCR at three time points. Results are shown as means ± SD. Difference between the indicated groups was statistically significant as judged by Student’s t test (*P < 0.05; **P < 0.01; ***P < 0.001).
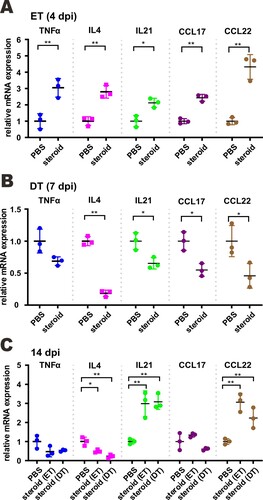
Figure 5. Effect of a combination of methylprednisolone and remdesivir in SARS-CoV-2-infected hamsters. (A) Diagram of the virus challenge scheme. Hamsters (n = 3) were intranasally inoculated with 105 PFU of SARS-CoV-2 and then intraperitoneally administered with either methylprednisolone (10 mg/kg) or PBS at 2 dpi. At 2 dpi and 3 dpi post-challenge, hamsters were intraperitoneally (i.p.) injected with remdesivir (15 mg/kg). At 4 dpi (i.e. 2 days after methylprednisolone injection), viral yields in the nasal turbinates, lung tissues and tracheas of the hamsters were detected by RT-qPCR and plaque assay. Alternatively, infected hamsters (n ≥ 3) were intramuscularly (i.m.) given either methylprednisolone (10 mg/kg) or PBS at 2 dpi. At 2 dpi and 3 dpi, hamsters were intraperitoneally injected with remdesivir (15 mg/kg). Viral loads were analyzed at 14 dpi. (B) Body weight changes of SARS-CoV-2-challenged hamsters (n = 6 at 0 dpi to 4 dpi; n = 3 at 5 dpi to 14 dpi). S: steroid only. R: remdesivir only. R + S: remdesivir plus steroid. Steroid was given intramuscularly. (C, D) Viral loads by RT-qPCR and plaque assay in the nasal turbinates, lungs and tracheas of SARS-CoV-2-challenged hamsters at 4 dpi and 14 dpi (n = 3/group). Difference between the indicated groups was statistically significant as judged by Student’s t test (*P < 0.05; **P < 0.01). Steroid was given intraperitoneally (C) and intramuscularly (D). (F) EIA analysis of anti-RBD antibodies in sera of treated mice at 14 dpi. Steroid was given intramuscularly.
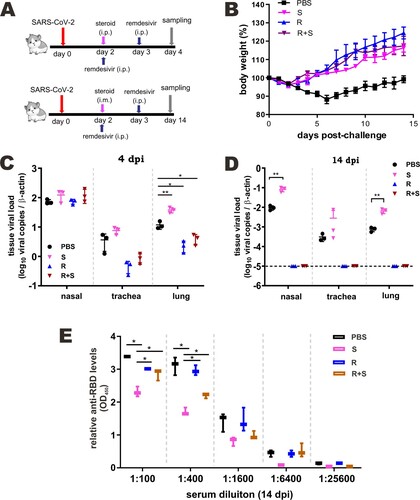
Figure 6. Effect of steroid and/or remdesivir on the histopathological changes in nasal turbinates and lungs of SARS-CoV-2-infected hamsters. Representative sections of the nasal turbinate and lung tissues from hamsters harvested at 4 dpi (A) and 14 dpi (B) were stained with hematoxylin and eosin. The arrows indicate inflammatory cell infiltration. Detection of SARS-CoV-2 N protein in lung tissue of SARS-CoV-2-infected hamsters treated with steroid (S) and/or remdesivir (R). SARS-CoV-2 N protein (green) was probed with rabbit anti-SARS-CoV-2 N antibodies followed by goat anti-rabbit antibodies conjugated to fluorescein. Nuclei were counterstained with DAPI (blue). Scale Bar = 100 μm for nasal turbinates; 200 μm for lungs.
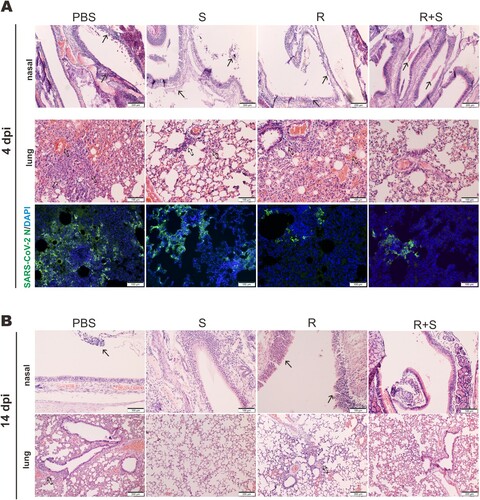
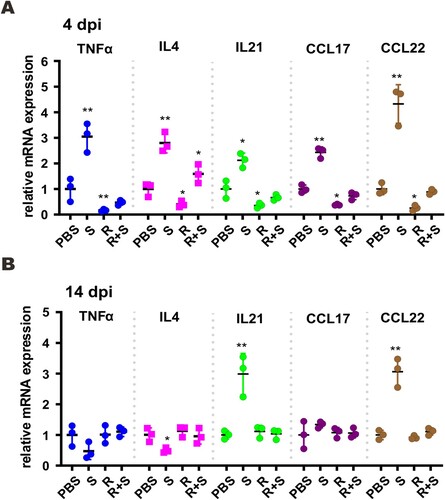
Figure 7. Proinflammatory cytokine and chemokine gene expression in SARS-CoV-2-infected hamster. Transcripts of representative chemokines and cytokines in the lung tissue homogenates of the indicated groups were detected by RT-qPCR at 4 dpi and 14 dpi. Results are shown as mean ± SD. Difference between the indicated groups was statistically significant as judged by Student’s t test (*P < 0.05; **P < 0.01). S: steroid only. R: remdesivir only. R + S: remdesivir plus steroid.