Figures & data
Figure 1. Antiviral activity of bovine and human lactoferrins against multiple common HCoVs and SARS-CoV-2 in cell culture. (A) The antiviral activity of bovine lactoferrin (BLF) against HCoV-229E, HCoV-NL63, HCoV-OC43 in CPE assay and SARS-CoV-2 in immunofluorescence imaging assay (from left to right). (B) The antiviral activity of human lactoferrin (HLF) against HCoV-229E, HCoV-NL63, HCoV-OC43 in CPE assay (from left to right). (C) Secondary viral yield reduction (VYR) assay of BLF against HCoV-229E, HCoV-NL63, HCoV-OC43 (from left to right). (D) Growth curves of HCoV-229E, HCoV-NL63, HCoV-OC43 (from left to right) in the absence (black) or presence of 500 µg/ml BLF (blue). EC50 curve fittings in the CPE and VYR assays were obtained using log10 (concentration of inhibitors) vs. percentage of CPE or percentage of positive control with variable slopes in prism 8. The cellular cytotoxicity test was included in CPE experiment and the resulting curves were shown in blue. All data are mean ± standard deviation of three replicates. (E) EC50 and CC50 values of BLF and HLF against multiple HCoVs and SARS-CoV-2 in cell culture.
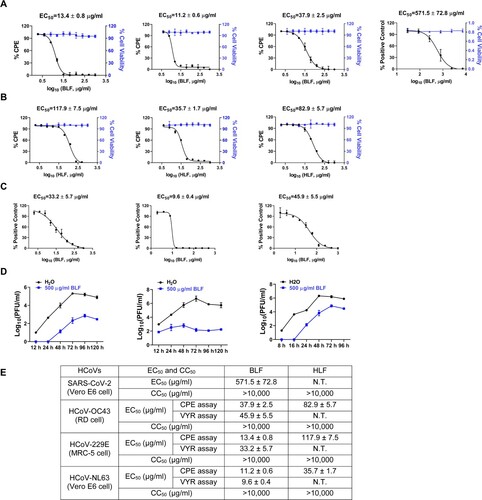
Figure 2. Time-of-addition experiments of BLF with HCoV-OC43 or SARS-CoV-2 pseudovirus particles. (A) Representative images of intracellular HCoV-OC43 virus detected by immunofluorescence staining using HCoV-OC43 specific antibody. Images were taken by ZoeTM Fluorescent Cell Imager (BioRad). (B) Illustration of the time periods when BLF (1000 µg/ml) was present in the time-of-addition experiments. Arrows represent the periods of time that BLF was present in the cell culture. (C) Quantification of HCoV-OC43 virus released into the cell culture medium using plaque assay. (D) Relative SARS-CoV-2 pseudovirus particle titers were quantified by measuring luciferase activity using Bright-Glo Luciferase Assay System and normalized to control. ***, p < 0.001 (student's t-test). Data are mean ± standard deviation of two replicates.
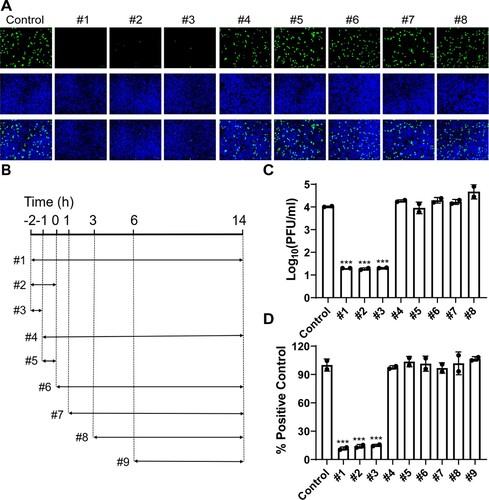
Figure 3. Inhibitory activity of BLF and HLF in the SARS-CoV-2 pseudovirus neutralization assay in different cell lines. (A) Vero E6 cell. (B) Calu-3 cell. (C) 293T cell overexpressing ACE2. Cathepsin L inhibitor E-64d and TMPRSS2 inhibitor camostat mesylate were included as controls in Vero E6 and Calu-3 cells, respectively. IC50 curve fittings using log10 (concentration of inhibitors) vs. percentage of DMSO control with variable slopes were performed in Prism 8. All data are mean ± standard deviation of two replicates.
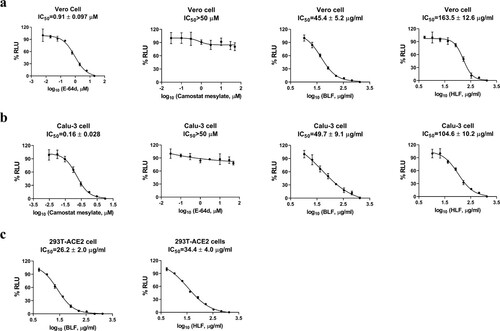
Figure 4. Evaluation of the direct effect of BLF on host cells or viral particles through pretreatment of cells or virus. (A) Representative immunofluorescence images of pretreating cells with 1000 µg/ml BLF or H2O. (B) Quantification of the results from panel (A). (C) Viral titers of HCoV-OC43 from cell culture medium of RD cells pre-treated with H2O or 1000 µg/ml BLF. (D) Expression levels of luciferase reporter gene in SARS-CoV-2 pseudovirus particles infected Vero E6 cells pre-treated with H2O or 1000 µg/ml BLF. (E) Infectious viral titers of HCoV-OC43 virus pre-treated with 1000 µg/ml BLF or H2O. **, p < 0.01; ***, p < 0.001 (student's t-test). Data are mean ± standard deviation of three replicates.
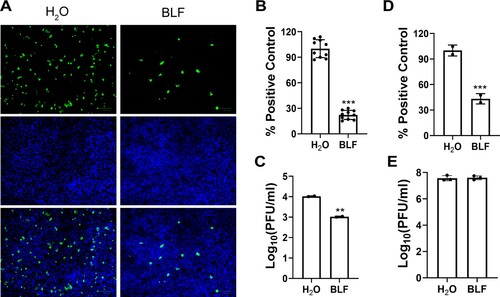
Figure 5. Effect of heparin on melting temperature (Tm) of BLF and HLF. Data were plotted with ΔTm vs. log10 (concentrations of heparin) using Boltzmann Sigmoidal equation in Prism 8 (left). Tm of lactoferrins in the absence or presence of indicated concentrations of heparin are shown in the table, and ΔTms were calculated by subtracting the Tm of LF without heparin. Data are mean ± standard deviation of two replicates.
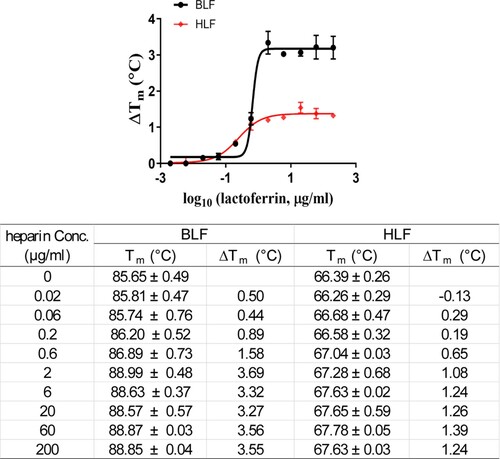
Figure 6. Heparin reduced the inhibitory activity of BLF on viral attachment to target cells. (A) Representative immunofluorescence images of HCoV-OC43 attached to RD cell surface detected by immunofluorescence staining. (B) Quantification of HCoV-OC43 attached to RD cell surface detected by RT-qPCR of N gene. (C) Quantification of HCoV-NL63 attached to Vero E6 cell surface detected by RT-qPCR of N gene. #1: H2O; #2: 500 µg/ml BLF; #3: 1000 µg/ml BLF; #4: 10 µg/ml heparin; #5: 30 µg/ml heparin; #6: 500 µg/ml BLF+10 µg/ml heparin; #7: 500 µg/ml BLF+30 µg/ml heparin. *, p < 0.05; **, p < 0.01; ***, p < 0.001 (student's t-test). All data are mean ± standard deviation of three replicates.
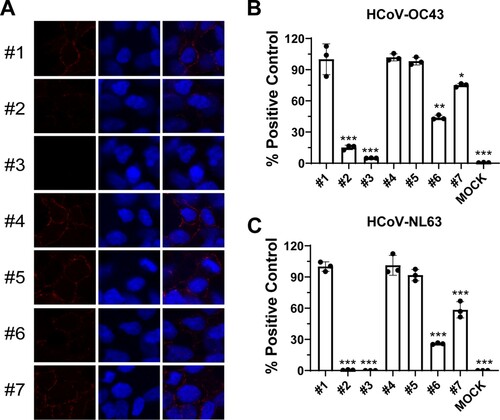
Figure 7. Antiviral potency of BLF in the absence or presence of different concentrations of heparin against HCoVs. Cells at near confluency were infected with (A) HCoV-229E; (B) HCoV-NL63; or (C) HCoV-OC43, different concentrations of BLF and indicated concentrations of heparin were mixed and immediately added into the cells for EC50 determination. EC50 curve fittings were obtained using log10 (concentration of inhibitors) vs. percentage of positive control (uninfected cells) with variable slopes in prism 8. (D) Antiviral EC50 values of BLF in the presence of different concentrations of heparin. (E) Combination therapy of remdesivir with BLF. Data are mean ± standard deviation of three replicates.
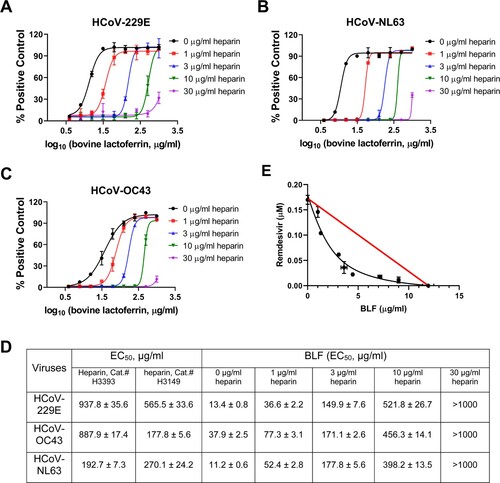
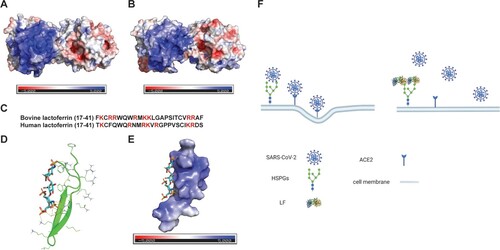
Figure 8. Structures of BLF, HLF, and the docking model of heparin dp4 with bovine lactoferricin. (A) Surface electrostatics of BLF (PDB: 1BLF). (B) Surface electrostatics of HLF (PDB: 1LFI). (C) Sequence alignment of the positively charged N-terminal domain of BLF and HLF. (D) Docking model of heparin dp4 with bovine lactoferricin (PDB: 1LFC). The heparin dp4 structure was from PDB 5E9C. (E) Surface view of the docking model of heparin dp4 with bovine lactoferricin. Docking was performed using AutoDock Vina and figures were generated using PyMOL. (F) Proposed antiviral mechanism of LF. The figure was created with BioRender.com.