
Figures & data
Figure 1. Flowchart of the studies.
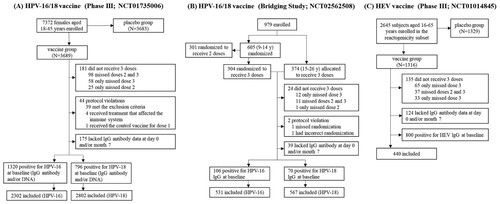
Table 1. Antibody levels of HPV-16 and -18 IgG in the presence of different ISAR (a phase III trial of Cecolin®).
Table 2. Antibody levels of HPV-16 and -18 IgG in the presence of different ISAR (a bridging study of Cecolin®).
Table 3. Antibody levels of HEV in the presence of different ISAR (a phase III trial of HEV vaccine).
Figure 2. HPV-16 and HPV-18 antibody levels at different SI values. According to the model, in the phase III trial of Cecolin®, the SI of subjects who never experienced an ISAR following vaccination was 0, while subjects with any ISAR had a SI between 1.00 and 12.44 in the DS of HPV-16 and 1.00–11.34 in the DS of HPV-18. All subjects were grouped based on their SI; the bar represents the GMC of HPV antibodies. Quadrinomial fitting curves are presented. GMC: geometric mean concentration.
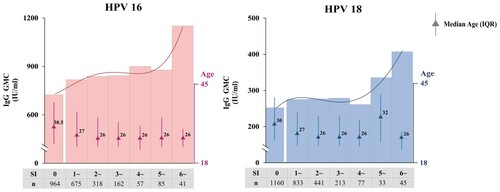
Table 4. Weight coefficient*.
Supplementary_material-EMI-20210120.docx
Download MS Word (74.3 KB)Data availability statement
The data that support the findings of this study are available from the corresponding author upon reasonable request.