Figures & data
Table 1. Assignment of tree shrew for immunization and virus challenge.
Figure 1. Tree shrew primary cells infected by HAdV species B. The primary cells from kidney, lung, and trachea of tree shrew were infected with 100 TCID50 of HAdV-55, -7, -14, or rAd3-EGFP. Human laryngeal carcinoma cell line HEp-2 was infected by the HAdVs as the control. Cells were observed at 72 h post-infection. Cells infected with rAd3-EGFP were also observed under a fluorescence microscope (200×).
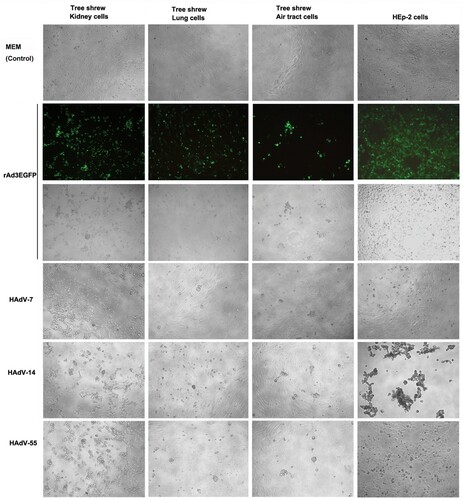
Figure 2. Primary tree shrew cells supported the effective replication of HAdV-55, -7, -14, or -3. (a) HAdV-55, -7, -14 or -3 genomic DNA copies were detected in primary tree shrew cells of kidney, lung, and trachea on 2, 48, 96, and 144 h post-infection by qPCR. (b) The amount of infectious HAdV-3, -55, -7, or -14 progeny produced from the tree shrew cells at 48 h post-infection were measured by infecting HEp-2 cells. HEp-2 cells were infected in parallel with HAdV-55, -7, -14, or -3 as the control.
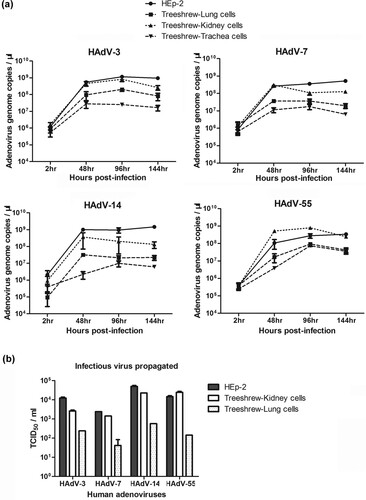
Table 2. Positive rate of neutralizing antibodies against different human adenovirus types in tree shrew (n = 18).
Figure 3. Body weight and body temperature change and viral genomic DNA detection in HAdV-55-infected tree shrews. (a) Experimental scheme of the tree shrew infection with HAdV-55. Fifteen tree shrews were intranasally inoculated with 5 × 10⁵ TCID50 of HAdV-55. Four control tree shrews were treated with PBS. All tree shrews were daily monitored for behaviour, body weight, and body temperature. Oropharyngeal swabs from each tree shrew were collected daily for viral load monitoring. At 1, 3, 5, 7, and 14 d post-infection (d.p.i), three tree shrews from the treatment group were euthanized and lung and turbinate bone tissues were collected for viral titration. One tree shrew from the control group was necropsied at 1, 3, 5, and 7 d.p.i. HAdV genomic DNA in animal tissue samples was extracted using QIAamp DNA Mini Kit (Qiagen Co. Ltd., Shanghai, China), followed by qPCR to quantify the viral DNA copies. (b) Body weight changes of tree shrews after infection with HAdV-55. (c) Changes of rectal temperature of tree shrews infected with HAdV-55. Statistically significant differences are denoted by * (P < 0.05), ** (P < 0.01); versus 0 d.p.i. (d) Viral DNA load in oropharyngeal swabs. (e) Viral DNA load in turbinate bone. (f) Viral DNA load in lung tissues. Each symbol represents an individual tree shrew and the horizontal lines indicate the mean values or the mean ± standard deviation (SD). (g) The neutralizing antibody titres against HAdV-55 in sera from HAdV-55-infected tree shrews were detected by a micro-neutralization test. (h) HAdV-55-specific IgG antibodies in sera from HAdV-55-infected tree shrews were detected by ELISA.
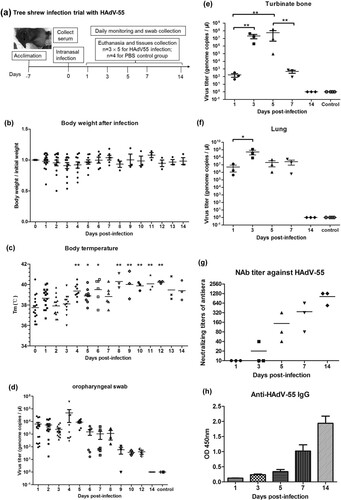
Figure 4. Histopathological lung changes in tree shrews infected with HAdV-55 at 1, 3, 5, 7, and 14 d post-infection. (a) Haematoxylin and eosin (HE) staining of the lung tissues. (b) Immunofluorescence analysis of HAdV-55 in the lung tissues of HAdV-55-infected tree shrew at 3 d post-infection. (c) Immunofluorescence analysis of HAdV-55 in lung tissue of control tree shrew treated with PBS. A mouse polyclonal antibody raised against HAdV-55 virions was used for HAdV-55-specific staining. Black scale bar, 100 μm; red scale bar, 200 μm; white scale bar, 50 μm.
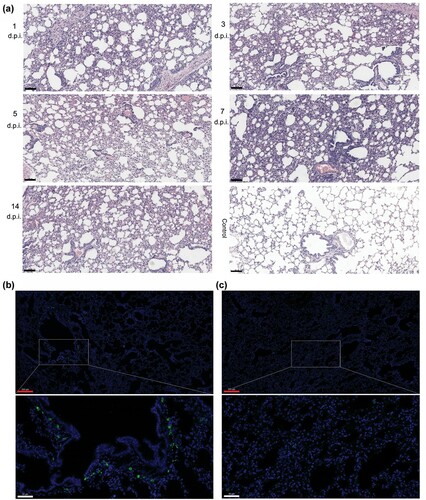
Figure 5. HAdV-55 challenge on pre-vaccinated tree shrews. (a) Experimental scheme of tree shrew challenge studies. Eleven tree shrews (immunized group) were intramuscularly vaccinated with inactivated HAdV-55 virions and 8 (control group) were intramuscularly vaccinated with MEM. Sera from the tree shrews were collected for NAb detection. The tree shrews were challenged with HAdV-55, and then humanely euthanized on days 3 and 5 post-challenge to collect their blood and tissues. Body weight, body temperature, and behaviour were measured daily. Viral loads in tissues and daily swabs were monitored. (b) The neutralizing antibody titres against HAdV-55 in sera from vaccinated tree shrews were detected by a micro-neutralization test. (c) Body weight and (d) body temperature was monitored at the indicated time points. (e) Viral DNA load in oropharyngeal swabs. (f) Viral DNA load in turbinate bone. (g) Viral DNA load in lung tissues. Each symbol represents an individual tree shrew, and the horizontal lines indicate the mean values or the mean ± standard deviation (SD). Statistically significant differences between the immunized and control groups are denoted by * (P < 0.05), ** (P < 0.01).
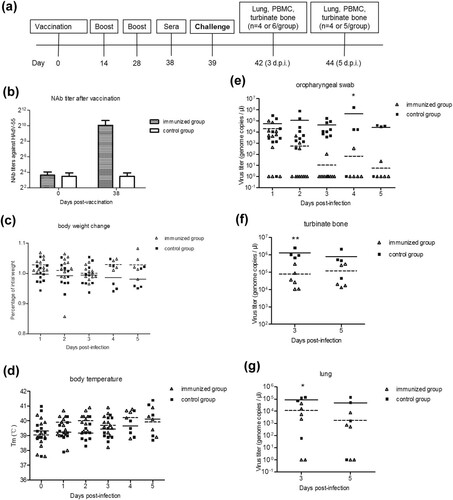
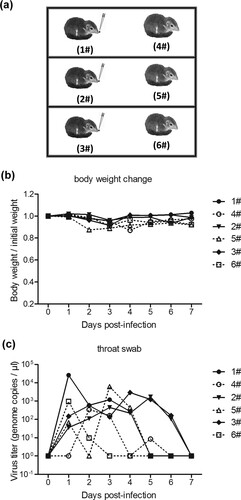
Figure 6. HAdV-55 experimental transmission among tree shrews. (a) Six tree shrews were separated into three independent cages and one animal from each cage was inoculated with HAdV-55. The tree shrews were monitored daily for body weight (b); oropharyngeal swab samples from each tree shrew were collected daily for viral DNA levels by qPCR (c).