3,175
Views
2
CrossRef citations to date
0
Altmetric
Research Article

Viral evolution sustains a dengue outbreak of enhanced severity

ORCID Icon, , ORCID Icon, ORCID Icon, , , , , , , , , ORCID Icon, ORCID Icon & ORCID Icon show all
Pages 536-544 | Received 10 Jan 2021, Accepted 01 Mar 2021, Published online: 27 Mar 2021

Figures & data

Table 1. Demographic data and clinical and biological parameters of the studied populations.

Figure 1. Phylogenetic tree of DENV-1 whole-genome sequences retrieved from dengue patients sera from 20132014 and 20162017. Whole-genome sequences retrieved from severe forms are highlighted in blue. The tree is midpoint rooted and bootstrap values above 80% are indicated. Two DENV-1 genomes from strains retrieved in NC in 2014 are displayed on the tree. The four amino acid substitutions detected in strains from 2016–2017 in comparison to strains from 2013–2014 are indicated.

Figure 1. Phylogenetic tree of DENV-1 whole-genome sequences retrieved from dengue patients sera from 2013–2014 and 2016–2017. Whole-genome sequences retrieved from severe forms are highlighted in blue. The tree is midpoint rooted and bootstrap values above 80% are indicated. Two DENV-1 genomes from strains retrieved in NC in 2014 are displayed on the tree. The four amino acid substitutions detected in strains from 2016–2017 in comparison to strains from 2013–2014 are indicated.

Figure 2. Replication kinetics of DENV-1 viral isolates from 20132014 and 2016–2017 in the human hepatic cell line HuH7. A DENV strain isolated in NC in 2014 passaged several times in C6/36 cells and yielding a high infection rate at day 3 post-infection was used as positive control. Human hepatic HuH7 cells were infected at a MOI of 1 with DENV-1 from 2013–2014 and 2016–2017. A. Percentages of HuH7 cells staining positive for 2H2 antibody measured by flow cytometry at days 1, 2 and 3 post-infection. Percentages of infected cells are normalized by the percentage of infected cells of the positive control at day 3 post-infection. B. Productivity of the infection measured as the viral titer in the supernatant of HuH7 at day 2 post-infection. C. Percentage of dead HuH7 cells staining positive for Viability dye measured by flow cytometry at days 1, 2 and 3 post-infection. NI: non-infected. Each dot is the mean of three independent replicates. Medians and interquartile ranges are indicated. ns: non significant difference in Wilcoxon-Mann-Whitney ranksum test.

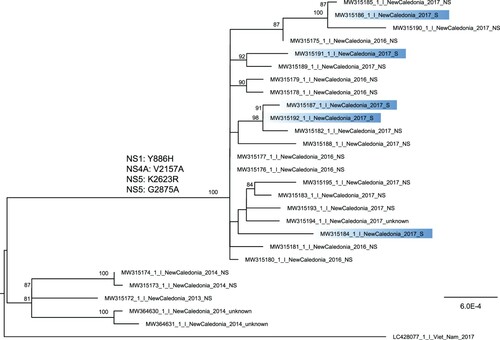
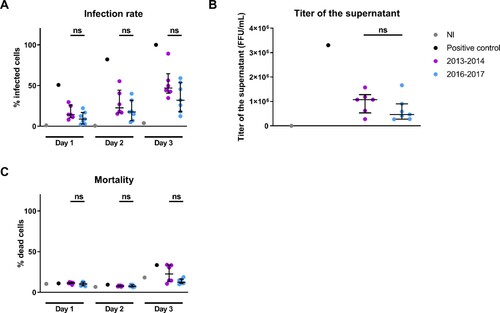
Figure 2. Replication kinetics of DENV-1 viral isolates from 2013–2014 and 2016–2017 in the human hepatic cell line HuH7. A DENV strain isolated in NC in 2014 passaged several times in C6/36 cells and yielding a high infection rate at day 3 post-infection was used as positive control. Human hepatic HuH7 cells were infected at a MOI of 1 with DENV-1 from 2013–2014 and 2016–2017. A. Percentages of HuH7 cells staining positive for 2H2 antibody measured by flow cytometry at days 1, 2 and 3 post-infection. Percentages of infected cells are normalized by the percentage of infected cells of the positive control at day 3 post-infection. B. Productivity of the infection measured as the viral titer in the supernatant of HuH7 at day 2 post-infection. C. Percentage of dead HuH7 cells staining positive for Viability dye measured by flow cytometry at days 1, 2 and 3 post-infection. NI: non-infected. Each dot is the mean of three independent replicates. Medians and interquartile ranges are indicated. ns: non significant difference in Wilcoxon-Mann-Whitney ranksum test.
Supplemental material

SevereDengueViralEvolution-SupFig2-1_editable.jpg

Download JPEG Image (6.5 MB)