Figures & data
Figure 1. Antiviral effect of microtubule-targeting agents on ASFV infection in vitro. (A) The chemical structures of colchicine, nocodazole, vinblastine and paclitaxel. (B) ASFV titre in Vero cells upon treatment with microtubule-targeting agents at indicated concentrations. This data represents the mean (±SD) of three independent experiments (n = 3). Significant differences compared to control are denoted by *(P < 0.05).
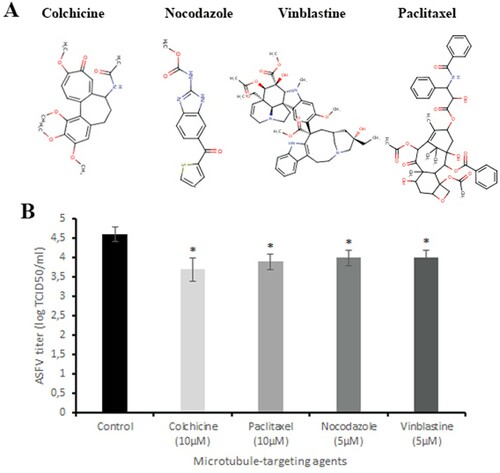
Figure 2. Screening of compounds interacting with the CBS of tubulin. (A) History of docking scores generated during virtual screening run to identify initial hits. Dots indicate individual scores for each compound generated from nine different runs. (B) Nine top scoring compounds selected for antiviral assay. Docking scores are presented in boxes. (C) ASFV titre in Vero cells upon treatment with selected compounds at 100 µM concentration. This data represents the mean (±SD) of three independent experiments (n = 3). Significant differences compared to control are denoted by *(P < 0.05).
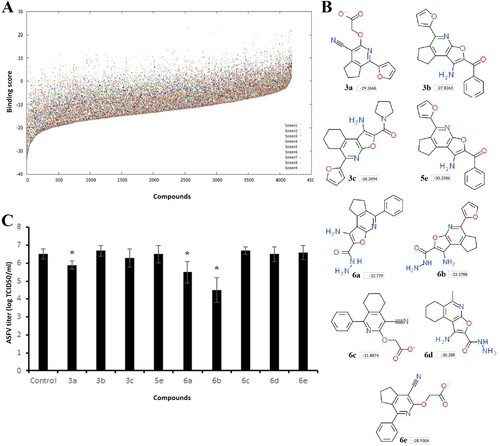
Figure 3. Chemical, cytotoxic and antiviral properties of compound 6b. (A) Physicochemical properties of tested compound calculated by SwissADME web tool. (B) Cytotoxicity of 6b on Vero cells evaluated by MTT assay. The CC50 was calculated by a linear regression analysis. (C) ASFV yield in Vero cells treated with 6b at several concentrations. The IC50 was calculated by a nonlinear regression. SI = CC50/IC50. (D) Time-of-removal study of compound 6b on ASFV infection. The compound was removed at specific intervals of post-infection. (E) Effect of 6b on ASFV entry into Vero cells. (F) Effect of 6b on ASFV egress from Vero cells evaluated by titration (bar graph) and ELISA (line graph). (G) ASFV spread in Vero cells treated with compound 6b. The concentration of tested compound in (D), (E), (F), (G) experiments was 100 µM or 50 µM. This data represents the mean (± SD) of three independent experiments (n = 3). Significant differences compared to control are denoted by *(P < 0.05) and **(P < 0.02).
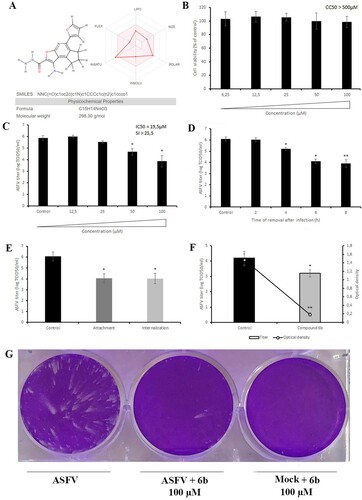
Figure 4. Antiviral effect of tested compound on post-entry stage of ASFV infection and viral factories. (A) Time-of-addition study of compound 6b on ASFV infection. The compound was added at specific intervals of post-infection. (B) ASFV factories (indicated by arrows) in Vero cells exposed to the thymidine analogue EdU at 8 h and at 16 h post-infection. (C) The DNA content of ASFV factories in cells treated with compound 6b at 8 h post-infection. In all experiments, the concentration of tested compound was 100 µM. This data represents the mean (±SD) of three independent experiments (n = 3). Significant differences compared to control are denoted by *(P < 0.05) and **(P < 0.02).
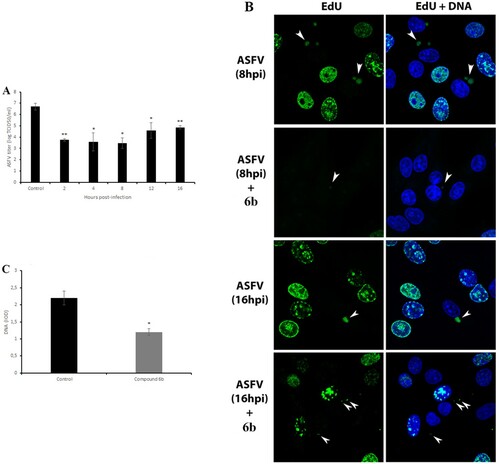
Figure 5. Analysis of ASFV early (pI215L) and late (pA104R) proteins synthesis. (A) Protein synthesis analysed by Western blotting in ASFV-infected Vero cells exposed or not to the 6b compound. β-actin was used as a loading control. (B) Vero cells stained for ASFV proteins (anti-ASFV) and viral pI215L protein at 8 h post-infection. (C) Analysis of pA104R expression and DNA synthesis in mock-infected and ASFV-infected Vero cells exposed or not to the 6b compound, by flow cytometry. In all experiments, compound 6b (100 µM) was added 1 h post-infection to exclude its inhibitory effect on ASFV entry process.
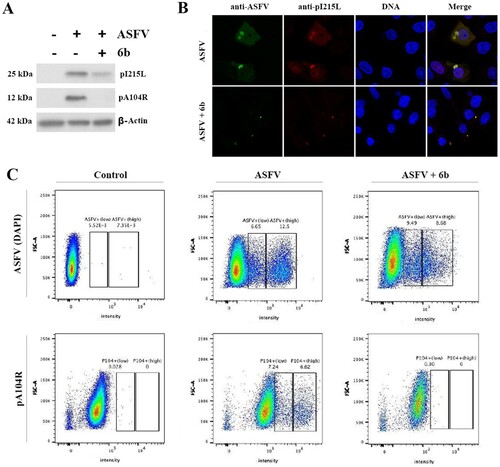
Figure 6. Antiviral activity of compound 6b against ASFV Armenia/07 strain in porcine macrophages. (A) Cytotoxicity of 6b on macrophages evaluated by MTT assay. The CC50 was calculated by a linear regression analysis. (B) ASFV titre in macrophages treated with 6b at several concentrations. (C) Time-of-addition study of compound 6b on ASFV infection in macrophages. The compound (100 µM) was added at specific intervals of post-infection. This data represents the mean (±SD) of three independent experiments (n = 3). Significant differences compared to control are denoted by *(P < 0.05).
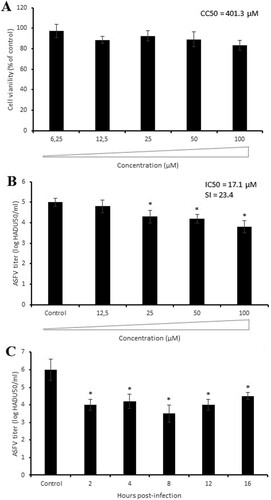
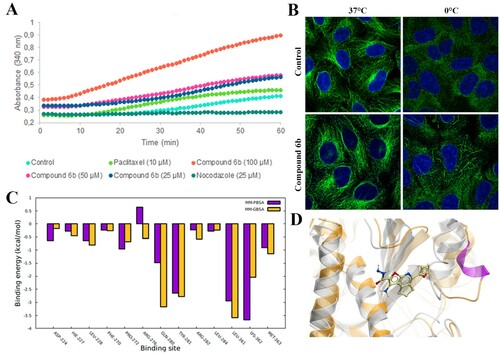
Figure 7. Interaction of compound 6b with tubulin. (A) In vitro tubulin polymerization assay conducted with pure porcine tubulin (>99%) in the presence of compound 6b and microtubule-targeting agents. (B) Stabilization of the tubulin filaments in Vero cells exposed to the compound 6b at 37°C and 0°C. (C) Tubulin-6b binding energy decomposition per amino acid in the taxane site. (D) Compound 6b in the taxane site. The grey coloured structure is the initial structure and the orange is the structure after MD simulation.