Figures & data
Figure 1. Serological investigation of SARS-CoV-2 in food workers in Wuhan. (A) Enzyme-linked immunosorbent assay (ELISA) screening of SARS-CoV-2 nucleocapsid protein (NP) IgG antibodies (n=508 subjects). The cutoff (dashed line) was five times the mean value of negative samples. Serum samples from healthy donors were used as the control (n=30). (B) Same ELISA test using a commercial kit. (C) NP IgG antibody levels in two consecutive serological tests (n=21).
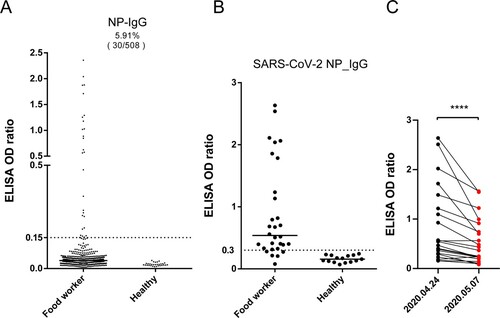
Figure 2. Phylogenetic tree of SARS-CoV-2 genomes. Three full-length genomes were obtained from three asymptomatic subjects collected on May 30 (AP43) or June 1 (AP44 and AP45) 2020 and were clustered with 1,927 publicly available representative genomes downloaded from the GISAID database. Sampling time is indicated at the end of each genome.
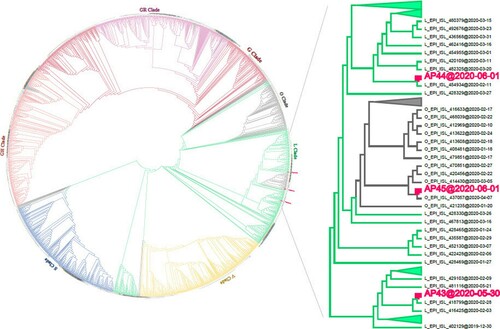
Figure 3. Asymptomatic subjects exhibit a weak serological response. (A, B) Comparison of IgG_RBD (A) and IgM_RBD (B) between asymptomatic subjects (n=24) and recovered symptomatic patients (n=60). Serum samples from healthy donors were used as controls (n=20). The median values are shown. Statistical significance was calculated using an unpaired Student’s t-test, **P < 0.01; ****P < 0.0001. (C) Neutralizing titers of selected serum samples from asymptomatic and symptomatic patients. IgG_RBD ELISA values and neutralizing antibody (nAb) titers are shown. The titer was tested using surrogate neutralization assays, shown as inhibition ratio (column C).
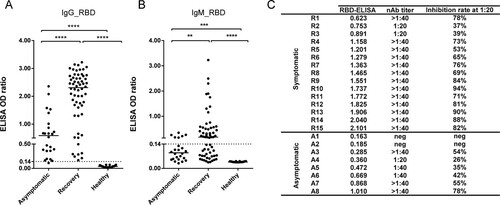
Figure 4. Lymphocyte ratio and signature cytokine levels in blood. (A) Flow-cytometric analysis of major lymphocyte populations in peripheral blood cells (PBCs) in asymptomatic subjects (n=10), 2-month recovered symptomatic patients (n=5), symptomatic acute infection (n=9) and healthy individuals (n=8). Data are shown as percentages of PBCs. (B) Comparison of blood IL-6 (left) and TNF-α (right) concentrations between asymptomatic subjects (n=15), 2-month recovered symptomatic patients (n=14), and symptomatic acute infection (n=14) or healthy donors (n=7). Human sera were used at 1:4 as recommended by the ELISA kit manufacturer. Mann-Whitney tests were used. Means ± SDs are shown. *P < 0.05; **P < 0.01; ***P < 0.001; ****P < 0.0001; ns, no significance.
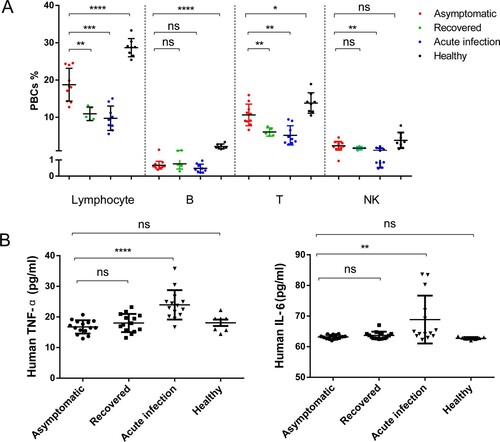
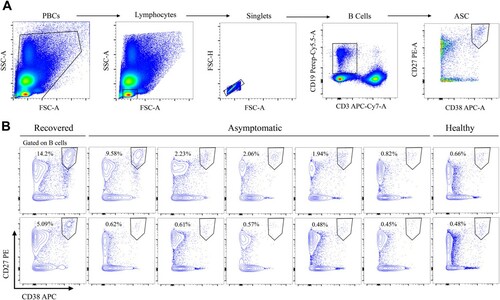
Figure 5. Frequency of CD3−CD19+CD27hiCD38hi antibody-secreting cells (ASCs). (A) Gating strategy for ASCs in flow cytometry. (B) Frequency of ASCs in asymptomatic subjects (n=10), compared to that in recovered symptomatic individuals (positive control, n=2) or healthy donors (negative control, n=2).