
Figures & data
Figure 1 . Strategy for the construction of rRABV expressing U-OMP19 and the evaluation of its gastrointestinal protease resistance in vitro. (A) Schematic diagram for the construction of LBNSE-U-OMP19. The parent vector pLBNSE was constructed based on the SAD-B19 strain by deleting the pseudogene between the G and L genes where BsiwI and NheI restriction enzyme sites were introduced. N, P, M, G and L represent the nucleoprotein, phosphoprotein, matrix, glycoprotein, and polymerase genes of RABV, respectively. Multistep virus growth curves were determined with BSR cells (B) and NA cells (C). Cells were infected with either LBNSE or LBNSE-U-OMP19 at a multiplicity of infection (MOI) of 0.01. Culture supernatants were collected at 1, 2, 3, 4 and 5 dpi for viral titration. The virus growth curves were drawn according to the viral titres measured at each time point, and data are presented as the mean ± SEM (n = 3). (D) Expression of U-OMP19 was detected in infected BSR cells by western blotting. BSR cells were infected with rRABVs at different MOIs (1, 0.1 and 0.01), and cells were collected at 48 post infection. The expression of U-OMP19, RABV N and GAPDH was detected in cell lysates by western blotting, and the expression of U-OMP19 was detected in culture supernatants as well. The degradation of RABV G and N proteins after 1 h or 2 h of incubation with artificial fluids, including gastric fluids (E) and intestinal fluids (F), was detected by western blotting assay. The data are representative of results from two independent experiments. (*p < 0.05; **p < 0.01).
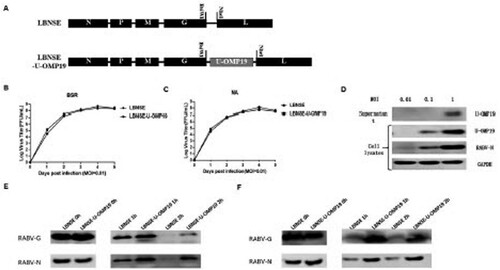
Figure 2. Expression of U-OMP19 attenuates RABV pathogenicity in vivo. Groups of six-week-old female ICR mice (n = 10) were inoculated via the i.c. route with 3 × 10⁶ FFU of LBNSE or LBNSE-U-OMP19 or mock injected with DMEM. Body weight losses were monitored for 14 days, and the body weight change curves are depicted (A). Furthermore, groups of 6-week-old female ICR (n = 5) were infected via the i.c. route with 3 × 10⁶ FFU of LBNSE or LBNSE-U-OMP19, and the levels of viral genomic RNA (B) and the mRNA levels of RABV N (C), U-OMP19 (D), IL-1β (E), TNF-α (F) and IL-6 (G) were quantified by qRT-PCR. To evaluate the pathogenicity of rRABVs in suckling mice, litters of 5-day-old ICR mice (n = 15) were infected via the i.c. route with 100 FFU of LBNSE or LBNSE-U-OMP19 or mock infected with DMEM, and survival rates were monitored daily for 21 days (H). The error bars represent the mean ± SEM (n = 5), and the data are representative of the results of two independent experiments. (*p < 0.05; **p < 0.01; ***p < 0.001; ****p < 0.0001).
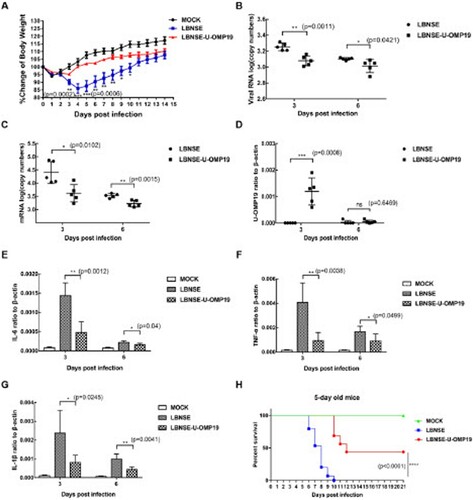
Figure 3. Recruitment and activation of DCs in orally immunized mice. Groups of six-week-old female ICR mice were orally immunized with 107 FFU of LBNSE or LBNSE-U-OMP19 or mock immunized with DMEM. CLNs and MLNs were harvested at 7 and 14 dpi. Single-cell suspensions prepared from collected lymph nodes were analysed for activated DCs by FACS. The gating strategies (A) and representative cytometric plots (B) for activated DCs (CD11c+CD86+ or CD11C+CD80+) are presented. The percentages of activated DCs (CD11c+CD80+ or CD11C+CD86+) in CLNs and MLNs (C–F) are shown. The data are representative of two independent experiments and are presented as the mean ± SEM (n = 3). (*p < 0.05; ns: non-significant).
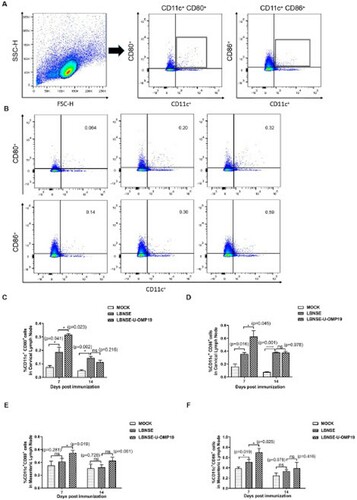
Figure 4. Recruitment of TFH cells in orally immunized mice. Groups of six-week-old female ICR mice were orally immunized with 107 FFU of LBNSE or LBNSE-U-OMP19 or mock immunized with DMEM. CLNs and MLNs were harvested at 7 and 14 dpi. Single-cell suspensions prepared from collected lymph nodes were analysed for the recruitment of TFH cells by FACS. The gating strategies (A) and representative cytometric plots (B) for TFH cells (CD4+CXCR5+PD-1+) are presented. The percentages of TFH cells detected in CLNs (C) and MLNs (D) in immunized mice are shown. The data are representative of two independent experiments and are presented as the mean ± SEM (n = 3). (*p < 0.05; ***p < 0.001).
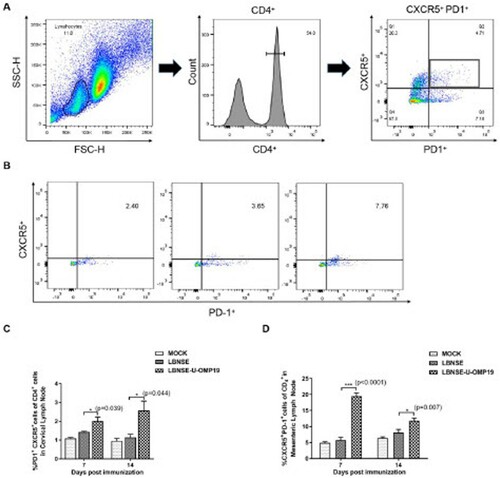
Figure 5. Generation of GCs in orally immunized mice. Groups of 6-week-old female ICR mice were orally immunized with 107 FFU of LBNSE or LBNSE-U-OMP19 or mock immunized with DMEM. CLNs and MLNs were harvested at 14 dpi. Tissue sections were prepared to detect GCs (B220+, blue; IgG+, green; GL7+, red). Scale bars, 1000 or 200 μm (rightmost column only). The representative results of GC formation in CLNs (A) and MLNs (B) are shown. The numbers of GCs formed at 14 dpi in CLNs (C) and MLNs (D) were calculated. The data are representative of two independent experiments and are presented as the mean ± SEM (n = 3). (*p < 0.05; **p < 0.01).
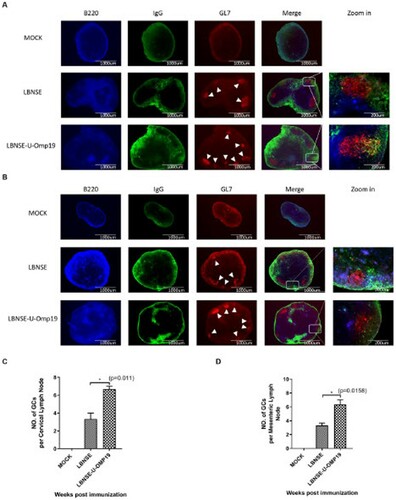
Figure 6. Generation of GC B cells in orally immunized mice. Groups of six-week-old female ICR mice were orally immunized with 107 FFU of LBNSE or LBNSE-U-OMP19 or mock immunized with DMEM. CLNs and MLNs were harvested at 7 and 14 dpi. Single-cell suspensions prepared from collected lymph nodes were analysed for GC B cells by FACS. The gating strategies (A) and representative cytometric plots (B) for GC B cells (B220+CD95+GL-7+) are presented. The percentages of TFH cells detected in CLNs (C) and MLNs (D) in immunized mice are shown. The data are representative of two independent experiments and are presented as the mean ± SEM (n = 3). (*p < 0.05; **p < 0.01).
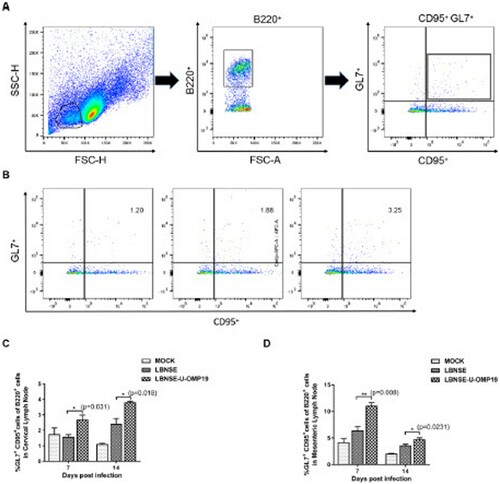
Figure 7. PCs populations in orally immunized mice. Groups of 6-week-old female ICR mice were orally immunized with 107 FFU of LBNSE or LBNSE-U-OMP19 or mock immunized with DMEM. Bone marrow was harvested at 7 and 14 dpi, and single-cell suspensions were prepared to detect PCs by FACS. The gating strategies (A) and representative cytometric plots (B) for PCs (B220lowCD138+) are presented. The percentages of PCs detected in the bone marrow (C) of immunized mice are shown. The data are representative of two independent experiments and are presented as the mean ± SEM (n = 3). (*p < 0.05; ns: non-significant).
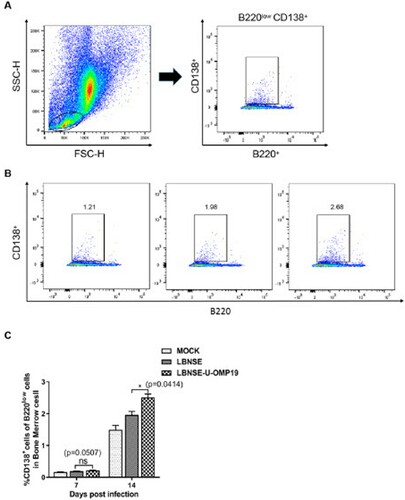
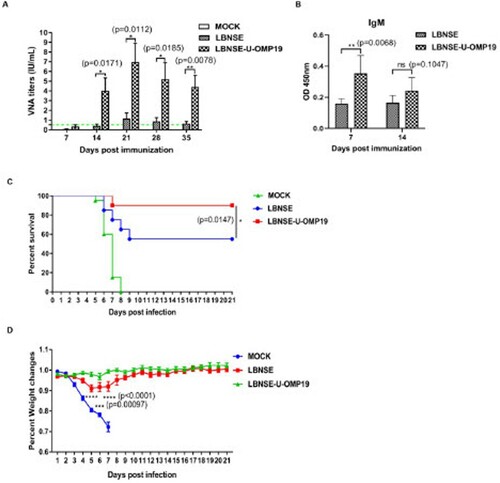
Figure 8. VNA production and protection after challenge of orally immunized mice. Groups of six-week-old female ICR mice (n = 10) were orally immunized with 107 FFU of LBNSE or LBNSE-U-OMP19 or mock immunized with DMEM. At the indicated time points post immunization, peripheral blood samples were collected, sera were separated to quantify VNA titres by using FAVN (A), the green dash line indicates VNA titre of 0.5 IU/mL. The RABV-specific IgM antibody levels (B) in the collected sera samples were also measured by ELISA. The data are presented as the mean ± SEM (n = 10). To determine protection, groups of six-week-old female ICR mice (n = 20) were orally immunized with 107 FFU of LBNSE or LBNSE-U-OMP19 or mock immunized with DMEM, and the immunized mice were infected via the i.c. route with 50 LD50 of CVS-24 at 4 weeks post immunization, and the survival rates (C) and body weight changes (D) were monitored and recorded for 21 days. The data are representative of two independent experiments. (*p < 0.05; **p < 0.01; ***p < 0.001; ****p < 0.0001).
Supplemental Material
Download MS Word (14.3 MB)Data availability statement
All datasets generated for this study are included in the article.