Figures & data
Figure 1. MDMs are susceptible to ZIKV infection. Human monocyte-derived macrophages (MDMs) and dendritic cells (moDCs) were uninfected or infected with ZIKVPR or ZIKVU at an MOI of 1.0. At 48 h post-infection (hpi), the cells were fixed with 4% paraformaldehyde and then permeabilized with 0.2% Triton X-100. (A) Viral double-stranded RNA (dsRNA) and (B) envelope (E) protein were identified with J2 and 4G2 antibodies, respectively, and imaged with confocal microscopy. In parallel, MDMs and moDCs were infected with ZIKVPR or ZIKVU at an MOI of 0.1. At 24hpi and 48hpi, ZIKV-infected and mock-infected cells were fixed and stained with J2 or 4G2, and subsequently applied to flow cytometry to determine expression levels of (C) viral dsRNA and (D) E protein. The dot-plot showed data of one representative donor. Statistical analyses in all panels were performed with Student’s t-test and the differences were considered significant when p < 0.05. *p < 0.05, **p < 0.01. ns, not significant. The histogram showed the mean values and standard deviations from three donors. Bars represented 10 μm.
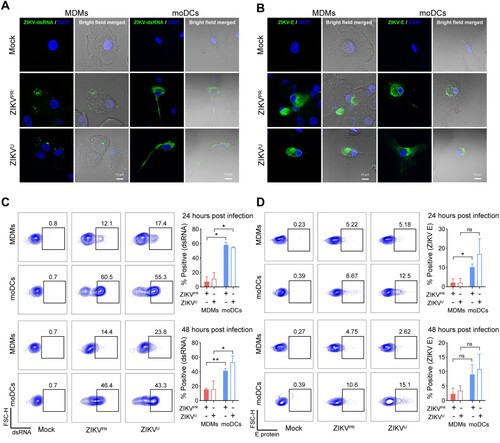
Figure 2. MDMs but not moDCs restrict ZIKV replication. MDMs and moDCs were infected with ZIKVPR or ZIKVU at an MOI of 0.01 or 1.0. Viral genome copy in the (A) cell lysates and (B) supernatants were determined by qRT-PCR. (C) The live infectious virus titer in the supernatants was measured by plaque assays. (D) MDMs and moDCs were infected with ZIKVPR or ZIKVU at an MOI of 0.1. The supernatants were harvested for determining the infectious virus titer by plaque assays at the indicated days post-infection. The (E) cell viability and (F) caspase-3/7 activities of uninfected and ZIKV-infected MDMs; and (G) cell viability and (H) caspase-3/7 activities of uninfected and ZIKV-infected moDCs were determined at the indicated time points by CellTiterGlo and CaspaseGlo 3/7 assays, respectively. Data represented mean and standard deviations from 3–6 donors. Statistical analyses in all panels were performed with two way-ANOVA and the differences were considered significant when p < 0.05. *p < 0.05,**p < 0.01, and ***p < 0.001.
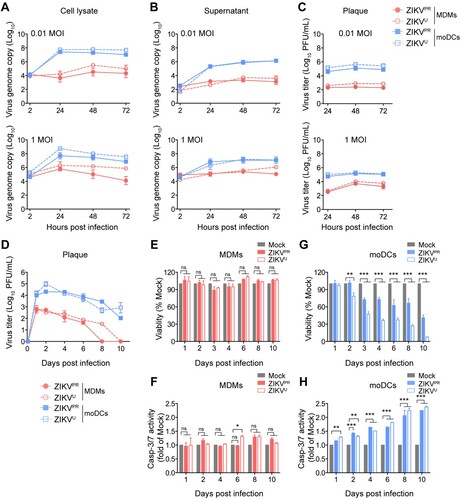
Figure 3. Restricted ZIKV replication in MDMs is not due to inefficient virus entry. (A) MDMs were untreated or treated with IL-13 (20 and 50 ng/mL) for 24 h and then subjected to determine the expression levels of ZIKV-related entry factors, including DC-SIGN, AXL, TIM-1, and MERTK by qRT-PCR. moDCs were included as a control. (B) MDMs were untreated or treated with IL-13 (50 ng/mL) for 24 h prior to infection with ZIKVPR or ZIKVU at an MOI of 0.01. The viral genome copy in the cell lysates was determined by qRT-PCR at 24hpi and 48hpi. (C) Viral entry capability in MDMs and moDCs were determined by qRT-PCR and normalized with GAPDH. Data represented mean and standard deviations from 3 donors. Statistical analyses in all panels were performed with one way-ANOVA and the differences were considered significant when p < 0.05. *p < 0.05, **p < 0.01, and ***p < 0.001. ns, not significant.
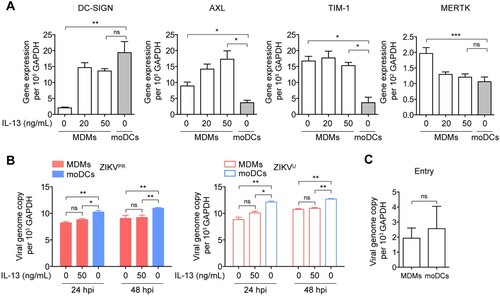
Figure 4. ZIKV infection does not antagonize type I IFN-mediated responses in MDMs. (A) Schematic illustration of human recombinant IFN-α treatment and ZIKV infection. (B) MDMs and moDCs were uninfected or infected with ZIKVPR at an MOI of 10.0 for 6 h, followed by mock treatment or treatment with 1000U/mL of recombinant human IFN-α for 6 h. Cell lysates were collected for detection of ISGs induction using qRT-PCR, including IFIT1, ISG15, MX1, and PKR; the fold activations were calculated as compared to mock groups. Data represented mean and standard deviations from 3 donors. Statistical analyses in all panels were performed with one way-ANOVA and the differences were considered significant when p < 0.05. **p < 0.01, ***p < 0.001, and ****p < 0.0001. ns, not significant.
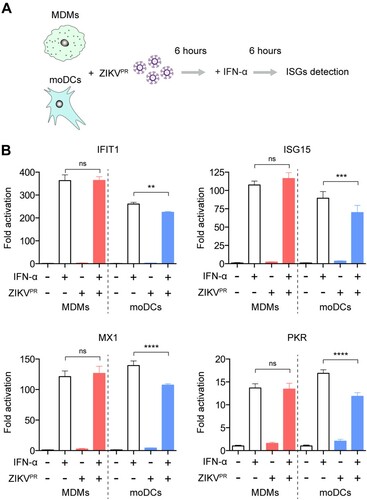
Figure 5. ZIKV infection fails to inhibit the phosphorylation of STAT1 and STAT2 in MDMs. (A) MDMs and moDCs were uninfected or infected with ZIKVPR at an MOI of 1.0. At 48hpi, the cells were untreated or treated with 1000U/mL of recombinant human IFN-α for 40 min. The cell lysates were harvested for detecting expressions of pSTAT1, pSTAT2, STAT1, STAT2, and β-actin by Western blots. Representative blots represented data from three independent experiments. (B) Quantitation was calculated as the ratio of pSTAT/STAT protein from three independent experiments. Statistical analyses in all panels were performed with one way-ANOVA and the differences were considered significant when p < 0.05. **p < 0.01, and ***p < 0.001. ns, not significant.
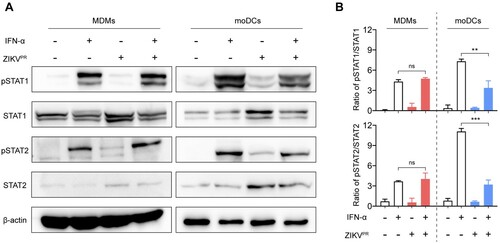
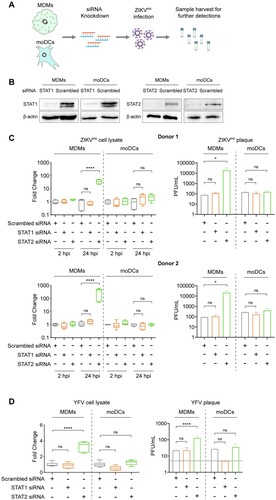
Figure 6. Depletion of STAT2 but not STAT1 rescues ZIKV and YFV replication in MDMs. (A) Schematic illustration of siRNA transfection and ZIKV infection. (B) MDMs and moDCs were transfected with scrambled siRNA or siRNA targeting STAT1 or STAT2. The knockdown efficiency of siRNA transfection was determined by Western blots. (C) MDMs and moDCs were generated from 2 donors. The cells were transfected with scrambled siRNA or siRNA targeting STAT1 or STAT2, followed by infection with ZIKVPR at an MOI of 1.0. At 2hpi and 24hpi, the cell lysates and supernatants were harvested for detection of viral genome copy and live infectious virus titer by qRT-PCR and plaque assays, respectively. (D) MDMs and moDCs were transfected with the same procedure as mentioned above and then infected with YFV at an MOI of 1.0. The cell lysates and supernatants were collected for further detection at 24hpi. Statistical analyses in all panels were performed with one way-ANOVA and the differences were considered significant when p < 0.05. *p < 0.05, and ****p < 0.0001. ns, not significant.