Figures & data
Figure 1 . Low extracellular pH enhances ZIKV infection of Vero cells. (A–E) Vero cells were incubated with ZIKV (A1C1-V2) for 1 h at different values of pH (moi 0.01). Then, cells were washed twice and ZIKV infection was analysed 48 h later in cell supernatants by pfu assays (A, B), qPCR (C), immunofluorescence (D), and flow cytometry using an anti-Env mAb (E). (F) Vero cells were incubated at pH 7.3 or 6.2 for 1 h at 37°C (moi 0.01) with different strains of ZIKV (Senegal, Venezuela or Puerto Rico isolates). Viral production was quantified in cell supernatants at days 1, 2 and 3 post-infection (p.i.). (G) Vero cells were incubated as described above with ZIKV (SEN) produced either in Vero cells or C6/36 cells. After 48 h, viral load was measured by qPCR. (H) Vero cells were incubated with ZIKV (moi 0.01) or with DENV-2 (moi 0.1), as described above. After 48 h, viral load was measured by qPCR. Data in A, D, E, F, G, and H are representative of three different experiments. Results in B and C were obtained in five independent experiments. Results are presented as mean ± SEM (B, C, D, G, H) and mean ± SD (A, F).
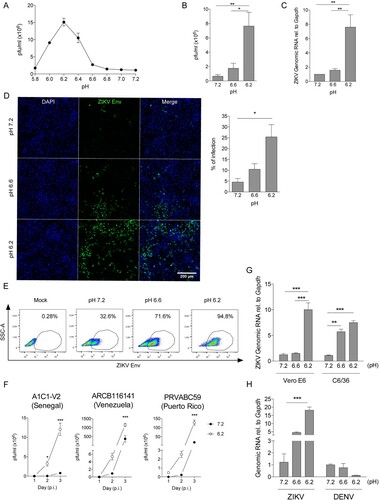
Figure 2. Acidosis enhances ZIKV infection in cells derived from the female reproductive tract and other target cells. Cells were incubated with ZIKV (A1C1-V2) at different pH values for 1 h at 37°C. Then, cells were washed and infection was assessed 72 h later. Infection of genital tract-derived cells VK2/E6E7 (A), Ect1/E6E7 (B), and End1/E6E7 (C) was quantified by measuring the extracellular concentration of NS-1 by Luminex. Infection of human endometrial fibroblasts (T-HESC) was quantified by qPCR (D). Infection of monocyte-derived macrophages (MDM) was quantified by measuring the extracellular concentration of NS-1 by Luminex (E). Primary culture-derived human astrocytes (NHA) infection was measured by qPCR (F). Human ectocervical (G) and endocervical (H) tissue cultures were dissected into 2 mm [Citation3] pieces and infected with ZIKV (VR-1844 moi 0.1) either at pH 7.3 or 6.2 for 1 h at 37°C. The viral production was evaluated at days 3, 6, 10, 13, 17, and 21 by measuring ZIKV NS1 in the culture supernatant. Results in A, B, C, D, and F represent data of two independent experiments. Data in E comprises the results of four different donors. Panels H and G were constructed with data of three independent experiments per explant type, and data were analysed using paired two-way ANOVA. Results are presented as mean ± SEM.
![Figure 2. Acidosis enhances ZIKV infection in cells derived from the female reproductive tract and other target cells. Cells were incubated with ZIKV (A1C1-V2) at different pH values for 1 h at 37°C. Then, cells were washed and infection was assessed 72 h later. Infection of genital tract-derived cells VK2/E6E7 (A), Ect1/E6E7 (B), and End1/E6E7 (C) was quantified by measuring the extracellular concentration of NS-1 by Luminex. Infection of human endometrial fibroblasts (T-HESC) was quantified by qPCR (D). Infection of monocyte-derived macrophages (MDM) was quantified by measuring the extracellular concentration of NS-1 by Luminex (E). Primary culture-derived human astrocytes (NHA) infection was measured by qPCR (F). Human ectocervical (G) and endocervical (H) tissue cultures were dissected into 2 mm [Citation3] pieces and infected with ZIKV (VR-1844 moi 0.1) either at pH 7.3 or 6.2 for 1 h at 37°C. The viral production was evaluated at days 3, 6, 10, 13, 17, and 21 by measuring ZIKV NS1 in the culture supernatant. Results in A, B, C, D, and F represent data of two independent experiments. Data in E comprises the results of four different donors. Panels H and G were constructed with data of three independent experiments per explant type, and data were analysed using paired two-way ANOVA. Results are presented as mean ± SEM.](/cms/asset/e79b65cf-a58f-4d7d-82f4-c793da6f7226/temi_a_1932606_f0002_ob.jpg)
Figure 3. Low extracellular pH increases ZIKV binding to target cells. Vero cells (A), VK2/E6E7 cells (B), or MDM (C) were incubated with ZIKV (A1C1-V2; moi 0.01) for 1 h at 37°C or 4°C, at different pH values. Then, cells were washed four times and total RNA was extracted to determine ZIKV binding by qPCR. Vero cells were incubated at different pH values with ZIKV (moi 0.01) for 1 h at 4°C, at different pH values. Then, cells were washed and cultured at neutral pH for 48 h. Viral production was quantified by pfu (D). Vero cells were cultured with ZIKV (moi 0.01) at pH 7.3 for 1 h at 37°C, washed, and incubated for 1 h at different pH values. Then, cells were washed again and cultured for 48 h at pH 7.3. Viral production was determined by pfu (E). DENV-2 and ZIKV binding to Vero cells were assessed in parallel as described above (F). ZIKV suspensions were pre-incubated at pH 7.3 or 6.2 for 1 h at 37°C. Then, the viral suspensions at pH 6.2 were neutralized back to pH 7.3 (6.2→7.3) or not, and Vero (G) and VK2 cells (H) were infected with these viral suspensions at pH 7.3 or 6.2. (I) Vero cells were pre-incubated for 1.5 h with 2, 20 and 100 mM of NH4Cl. Then ZIKV infections were performed in pH adjusted media with 2, 20, or 100 mM of NH4Cl respectively. Viral production was evaluated 48 h post-infection by pfu assay. (J) Vero cells were infected for 1 h in pH adjusted NaHCO3-free or NaHCO3 rich DMEM. ZIKV infection was quantified by pfu 48 h after infection. In parallel, BCECF-AM pre-loaded vero cells were treated with pH adjusted bicarbonate-free DMEM and intracellular pH was determined by flow cytometry. Results are expressed as the mean ± SEM of three independent experiments.
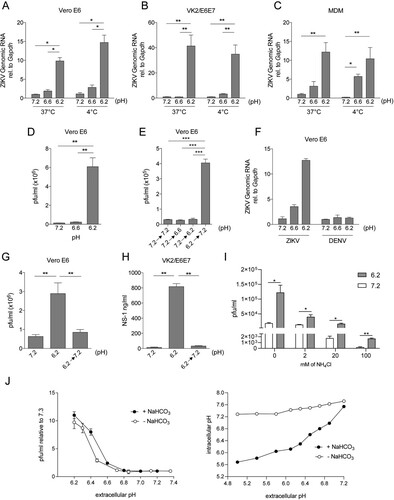
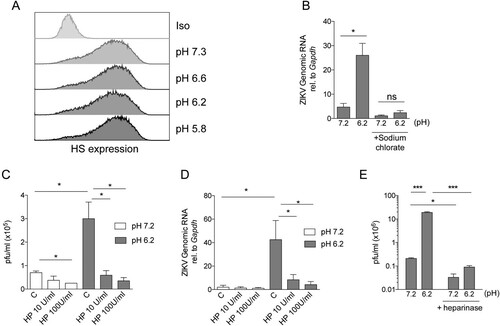
Figure 4. Enhancement of ZIKV infection by low pH depends on the expression of heparan sulfate by target cells. Vero cells were incubated for 1 h in pH adjusted media and 24 h later heparan sulfate expression was determined by flow cytometry (A). Vero cells were cultured for 3 days in sulfate-free media supplemented with sodium chlorate. Then, cells were challenged with ZIKV (A1C1-V2) for 1 h at 37°C, either at pH 7.3 or 6.2, and infection was analysed by qPCR 48 h later (B). Vero cells were challenged with ZIKV at pH 7.3 or 6.2 for 1 h at 37°C, in the absence (C: control) or presence of heparin (HP). Then, cells were washed and cultured for 48 h at pH 7.3 and infection was analysed (C). Vero cells were challenged with ZIKV at pH 7.3 or 6.2 for 1 h at 4°C, in the absence (C: control) or presence of heparin (HP). Thr binding of ZIKV to Vero cells was then analysed by qPCR (D). Vero cells were treated with heparinases for 2 h at 37°C and then infected either at pH 7.3 or 6.2. Forty-eight hours later infection was analysed by pfu assay (E). Results are expressed as the mean ± SEM of three independent experiments. ns, not significant.