Figures & data
Figure 1. AHFV infection and LD50 determination in IFNAR-/- mice. For the pilot study, groups of six mice were infected IP with 10 or 1000 TCID50 of either AHFV, strain 2003 or AHFV, strain Zaki-2. (A) Body weight and (B) survival curves are shown. Disease progression was significantly advanced for strain 2003 with both challenge doses (p = 0.0022). For the determination of the LD50, groups of six mice were infected with increasing doses (0.01–10 TCID50) of AHFV strain 2003 via the IP route. (C) Body weight (note, green line represents a single survivor from 6 dpi on) and (D) survival curves are shown. For the pathogenesis study, groups of six mice were infected with 1000 LD50 of AHFV 2003 (400 TCID50 per animal) via the IP route. (E) Body weight (each line represents one mouse) and (F) survival curves are shown. Error bars represent standard deviation.
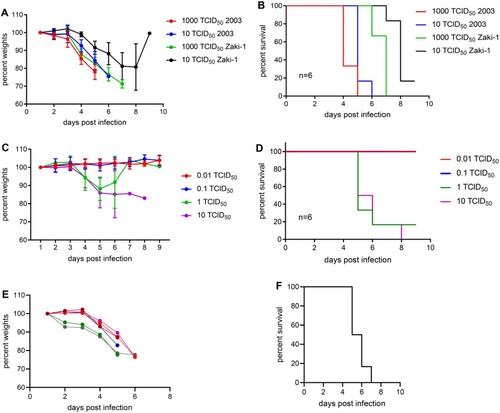
Figure 2. Haematology and blood chemistry in IFNAR-/- mice infected with AHFV. Groups of six mice were infected with 1000 LD50 of AHFV 2003 (400 TCID50 per animal) via the IP route. On 2 and 4 dpi samples were collected from mice and CBCs and blood chemistry were performed and compared to mock-infected animals. (A–F) Selected haematology cell counts are displayed. (G–L) Selected blood chemistry parameters are displayed. Due to poor sample quality, graphs G–L are based on three samples from 4 dpi group. Error bars represent standard deviations. Statistical significance is indicated as follows ****p < 0.0001, ***p < 0.001, **p < 0.01, and *p < 0.05.
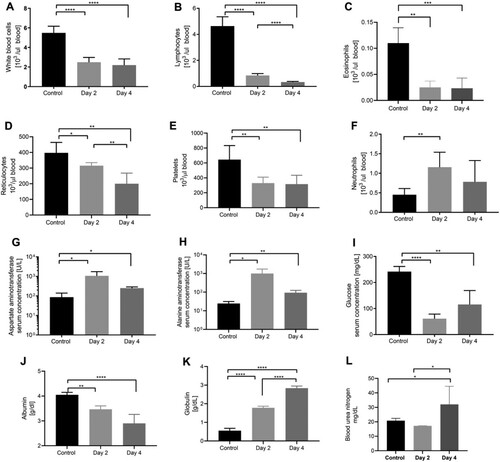
Figure 3. Plasma cytokine levels in mice infected with AHFV. Mice were infected IP with 1000 LD50 (400 TCID50). Animals were euthanized on 2 or 4 dpi and plasma samples were analyzed for cytokine expression in comparison to uninfected control mice. Results for TNF-α, IL-1β, IL-6, IL-17, IL-18, GM-CSF, IFN-γ, IL-12p40, MCP-1 and MIP-1β are shown. Error bars represent standard deviations. Statistical significance is indicated as follows ****p < 0.0001, ***p < 0.001, **p < 0.01, and *p < 0.05.
Figure 4. Histopathologic changes in IFNAR-/- mice infected with AHFV. Groups of six mice were infected IP with 1000 LD50 (400 TCID50) and euthanized at 2 dpi and 4 dpi for organ harvest. (A and B) H&E stain of spleens from mice at 4 dpi (A, Mock 400×; B, AHFV infection 400×). We observed a reduction in the white pulp and expansion of the red pulp in infected animals indicating lymphoid depletion. There was neutrophil infiltration and vascular occlusion by a fibrin thrombus (arrow). (C and D) H&E stain of livers from mice at 4 dpi (C, Mock 200×; D, AHFV infection 400×). Hepatocytes were swollen and contained lipid micro-vesicles. There was an increase in sinusoidal inflammatory cells and, along the bottom of the frame, a focus of necrosis (bottom arrow). Fibrin thrombi occluded adjacent vessels (top arrow). (E and F) H&E stain of cervical lymph nodes from mice at 4 dpi (E, Mock 200×; F, AHFV infection 200×). Lymph nodes from infected animals exhibited tremendous lymphocyte apoptosis, infiltrating neutrophils and occasional fibrin thrombi (arrow). (G and H) H&E stain of heart from mice at 4 dpi (E, Mock 200×; F, AHFV infection 200×). Increased cellularity due to interstitial inflammation was seen in infected animals (arrows).
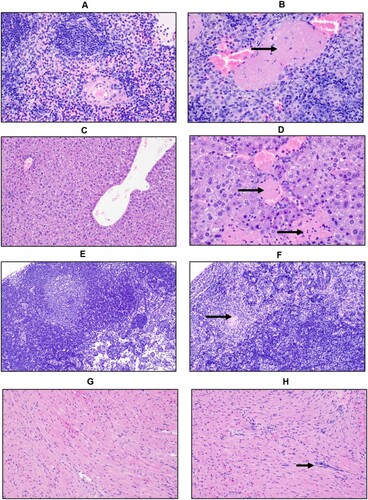
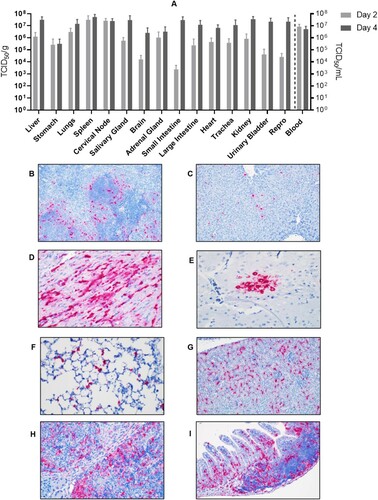
Figure 5. Tissue tropism of AHFV in infected mice. Groups of six mice were infected with 1000 LD50 (400 TCID50)/mouse via the IP route. The groups were euthanized on 2 and 4 dpi and organs were harvested to determine virus load. (A) The viral load in tissue is presented in TCID50/g; viremia is presented as TCID50/ml. (B–I) In-situ hybridization of AHFV genome in organs of infected mice. (B) Spleen 2 dpi; AHFV RNA was present at the marginal zone where the red and white pulp interact (200×); (C) Liver 4 dpi; AHFV RNA was located within individual mononuclear cells (Kupffer cells; 200×); (D) Heart 4 dpi; AHFV RNA corresponded with areas of inflammation (400×); (E) Brain 4 dpi; AHFV RNA was focally present within a cluster of neurons in the grey matter of the temporal lobe (400×); (F) Lungs 4 dpi; AHFV RNA was multifocally present throughout alveolar septa, presumably within macrophages (400×); (G) Kidney 4 dpi; AHFV RNA was detected within the interstitial tissue of the kidney (200×); (H) Cervical lymph node 4 dpi; AHFV RNA was located within mononuclear cells of the subcapsular sinuses and throughout lymphoid follicles (400×); (I) Small intestine, gut associated lymphoid tissue 4 dpi; AHFV RNA was present in GALT and lamina propria of intestinal villi (200×).