
Figures & data
Figure 1. Phylogenetic tree of S1 segment of novel reassortant MRV/USA/Porcine/2018. Related MRV strains were downloaded from GenBank, and open reading fame of each gene segment was used for building the phylogenetic trees. The MRV isolate identified in this study is labelled with a round dot.
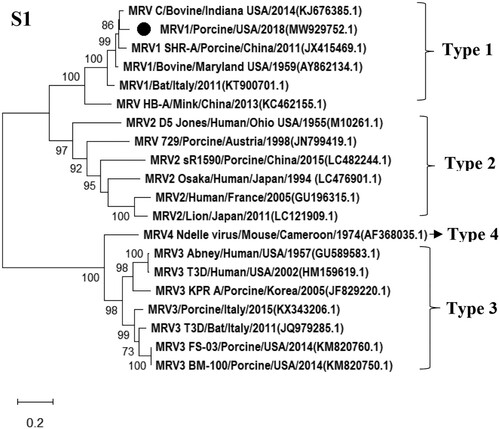
Table 1. Highest nucleotide identities of MRV strains with each gene segment of the novel reassortant MRV/Porcine/USA/2018.
Figure 2. Detection of MRV antigens in infected MDCK cells by IFA and growth dynamics of the MRV isolate in different cells. A) MDCK cells were mock-infected or infected with the novel MRV isolate for 48 h and fixed for IFA assay. The fixed cells were incubated with the anti-mu 1C monoclonal antibody and the FITC-labelled goat anti-mouse IgG second antibody. Nuclei were stained with 4’,6-diamidino-2-phenylindole (DAPI) (Scale bar 150 µm). B): A monolayer of each cell including swine ST, human A549, canine MDCK and monkey Marc145 cells was infected with the MRV isolate at a multiplicity of infection (MOI) of 0.05 TCID50. The data points of the curves indicate mean ± SD (n = 2). The asterisks (*) represent a statistically significant difference between groups (*p < 0.05, **p < 0.001, unpaired t test).
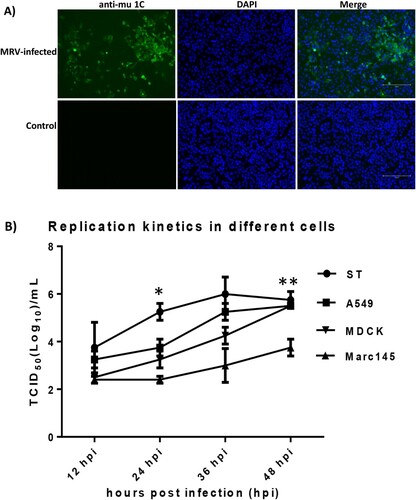
Figure 3. Viral RNA detection in both rectal and nasal swab samples collected from infected and control pigs. A) MRV RNA copy number detected in rectal swab samples collected from infected and control pigs. B) MRV RNA copy number detected in nasal swab samples collected from infected and control pigs.
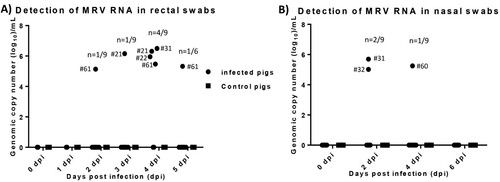
Figure 4. Analysis of sections of intestine and brain of infected and control pigs by H&E and IHC. A) H & E stain with prominent lymphoid follicular development in an infected pig (Scale bar, 500 μm). B) IHC for MRV with strong positive staining of follicular associated epithelium (FAE) and underlying lymphoid tissue in an infected pig. No staining noted in lymphoid follicles proper (Scale bar, 500 μm). C) The image represents segments of FAE overlying lymphoid follicles in the terminal ileum of an infected pig. Staining was consistently present on the lower lateral aspect of the FAE with mild staining in the lamina propria between the epithelium and underlying lymphoid follicle proper (Scale bar, 50 μm). D) The image represents segments of FAE overlying lymphoid follicles in the terminal ileum of in a control pig (Scale bar, 50 μm). E) H & E stain of the section from base of cerebellum inoculated pig #20. Prominent perivascular cuffs of lymphocytes, macrophage-like cells, and rare plasma cells. There is mild diffuse gliosis. In other areas, distinct foci of gliosis are prominent (Scale bar, 100 μm).
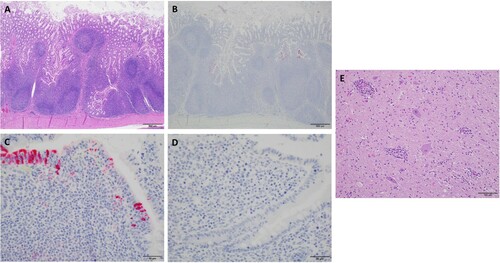
Table 2. MRV sero-prevalence in pigs at different geographical regions in the US.