
Figures & data
Figure 1. Schematic diagram of SARS-CoV-2 S protein and lipopeptide-based fusion inhibitors. (A) Functional domains of the S protein. SP, signal peptide; NTD, N-terminal domain; RBD, receptor-binidng domain; FP, fusion peptide; HR1, heptad repeat 1 region; HR2, heptad repeat 2 region; MPER, membrane-proximal external region; TM, transmembrane domain; CT, cytoplasmic tail. The S1/S2 and S2′ cleavage sites are marked with arrow. The HR1 and HR2 core sequences are listed, in which the potential residues mediating the HR1-HR2 interactions in a 6-HB structure are coloured in red. (B) SARS-CoV-2 HR2-MPER derived fusion inhibitor peptides and lipopeptides. The MPER amino acids are coloured in purple. Chol, cholesterol; C16, palmitic acid; C18, stearic acid; Toc, tocophenol; PEG, polyethylene glycol; GSGSG, a flexible amino acid linker.
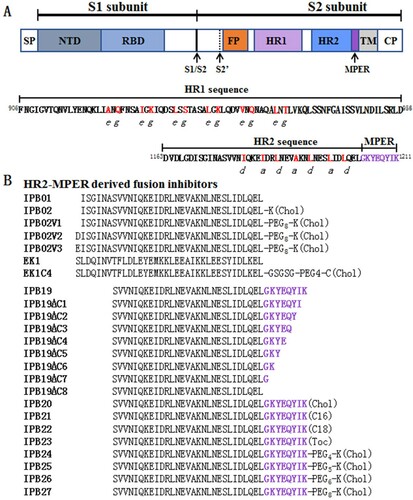
Figure 2. Mutational analysis of the SARS-CoV-2 spike MPER sequence. Infectivity of the SARS-CoV-2 mutant pseudoviruses in 293T/ACE2 cells (A) or Huh-7 cells (B) was determined by a single-cycle infection assay. (C) Fusogenic activity of the SARS-CoV-2 S mutants was determined by a DSP-based cell fusion assay. In comparison, the luciferase activity (RLU) of the wild-type (WT) was treated as 100% and the relative infection or fusion of a mutant was calculated accordingly. The experiments were repeated three times and data are expressed as the means ± standard deviations (SD). Statistical comparison was conducted by t-test (*, P<0.05; **, P<0.01; ***, P<0.001; ns, not significant).
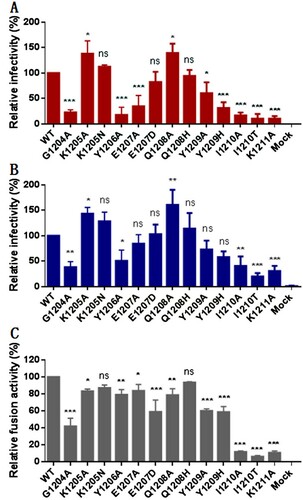
Figure 3. Structural and functional characterization of HR2-MPER derived peptide IPB19. The α-helicity (A) and thermostability (B) of IPB19 alone or in complex with an HR1-derived target mimic peptide N52 as well as the α-helicity (C) and thermostability (D) of C-terminally truncated IPB19 peptides complexed with N52 were determined by CD spectroscopy, with the final concentration of each peptide being 10 μM. The inhibitory activities of IPB19 and its truncated versions on S protein-mediated cell-cell fusion (E) and pseudovirus infection in 293T/ACE2 cells (F) were determined by DSP-based fusion assay and single-cycle infection assay, respectively. The CD experiment was performed two times and obtained consistent results and representative data are shown. The antiviral experiments were repeated three times, and data are expressed as the means ± SD.
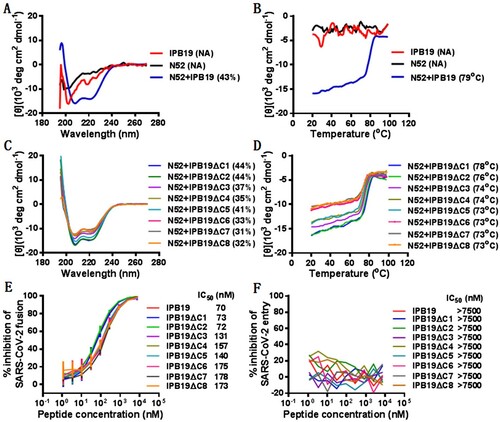
Figure 4. Inhibitory activity of IPB19-based lipopeptides against SARS-CoV-2. The inhibitory activities of IPB19-based lipopeptides on the SARS-CoV-2 S protein-mediated cell-cell fusion (A and C) and pseudovirus infections in 293T/ACE2 cells (B and E) or Huh-7 cells (C and F) were determined by DSP-based cell fusion assay and single-cycle infection assay, respectively. The inhibitory activity of three lipopeptides against live SARS-CoV-2 infection in Vero cells (G) as well as their cytoxicity on Huh-7 cells (H) or Vero cells (I) were respectively determined. The experiments were repeated three times, and data are expressed as the means ± SD.
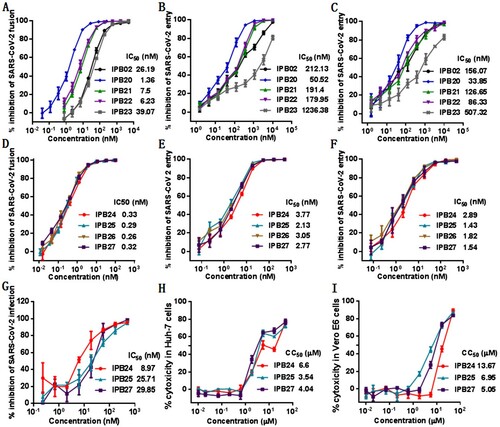
Figure 5. Inhibitory activity of new lipopeptides against emerging SARS-CoV-2 variants. The inhibitory activities of IPB19-based lipopeptides on the SARS-CoV-2 pseudoviruses bearing the S protein with the emerging mutaions of D614G (A), N501Y (B), Δ69-70 (C), E484K (D), N501Y/Δ69-70/P681H (E), and N501Y/E484K/K417N (F) were determined in Huh-7 cells by the single-cycle infection assay. The experiments were repeated three times, and data are expressed as the means ± SD.
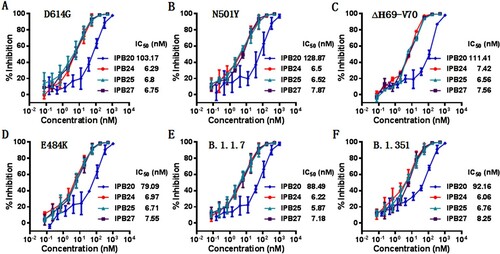
Figure 6. Broad-spectrum inhibitory activity of IPB19-based lipopeptides against divergent human CoVs. The inhibitory activity of IPB19 derivatives against the SARS-CoV (A), MERS-CoV (B), HCoV-NL63 (C) and HCoV-229E (D) pseudovirus infections in Huh-7 cells was determined by single-cycle infection assays. The experiments were repeated three times, and data are expressed as the means ± SD.
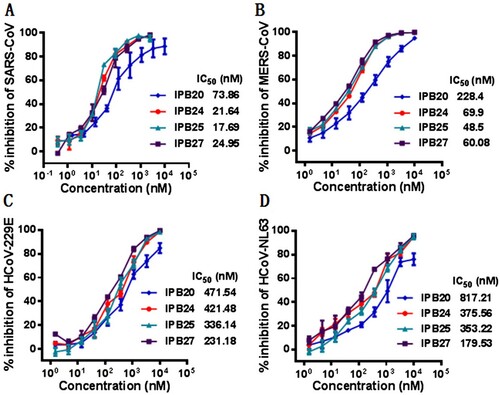
Figure 7. Structural properties of new lipopeptides determined by CD spectroscopy. The α-helicity and thermostability of lipopeptides alone (A and B) or in complex with HR1 peptide N52 (C and D) were determined by CD spectroscopy, with the final concentration of each peptide being 10 μM. The experiment was performed two times and obtained consistent results and representative data are shown.
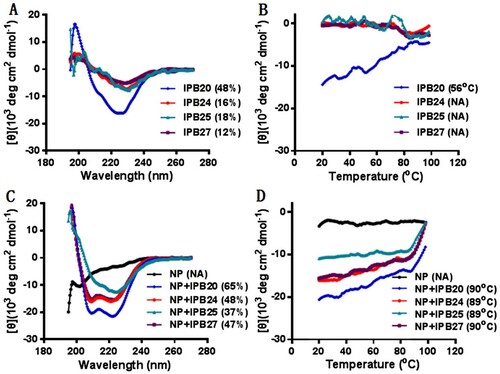
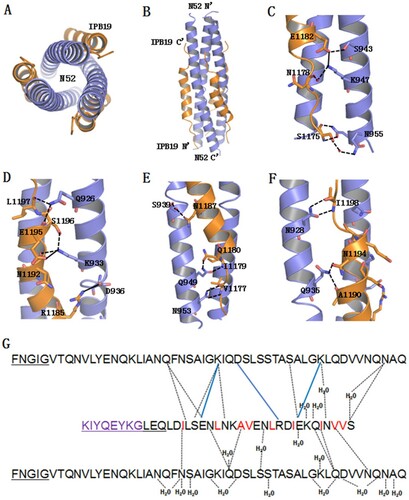
Figure 8. Crystal structure of IPB19 complexed with N52. (A and B) The overall structure of IPB19/N52-based six-helical bundle (6-HB) is shown in a ribbon model and viewed from the bottom (A) or front (B) side, in which N52 helices (blue) form an interior, trimeric coiled coil with three hydrophobic grooves, three IPB19 helices (orange) pack into each of the grooves in an antiparallel orientation. (C-F) Detailed interactions between IPB19 and N52. The residues critical for the interactions are shown in sticks and labelled. The solid lines represent salt bridges, the dashed lines represent hydrogen bonds. (G) Sequence illustration of IPB19 binding. A single IPB19 peptide interacting with two N52 helices is shown in a sequence map. The blue solid lines represent salt bridges, the black dashed lines represent hydrogen bonds, and residues marked in red represent hydrophobic interactions. The residues in the C-terminal of IPB19 and the N-terminal of N52 that could not be visualized due to too low electronic density are underlined.
Supplemental Material
Download MS Word (33.9 KB)Data availability statement
All data are fully available without restriction. The atomic coordinates and structure factorshave been deposited in the Protein Data Bank under the accession code:7EK6.