Figures & data
Figure 1. SARS-CoV-2 infection was established in hACE2 transgenic mice. (a) Time points of mouse sampled and challenged with SARS-CoV-2 and H1N1. (b) SARS-CoV-2 shedding in the nose, oropharynx and faeces were detected in the SARS-CoV-2-infected mice and uninfected mice. The samples were from 20 µl nasal washings, the whole oropharynx swabs and 100 mg faeces. (c) The SARS-CoV-2 virus titres in the lung were detected during SARS-CoV-2 infection in the SARS-CoV-2-infected mice and uninfected mice and peaked on 1 and 3 dpi after SARS-CoV-2 infection. The data were shown by log10 of CCID50 per 1 g lung tissue. (d) The SARS-CoV-2 virus loads in 100 mg or 100 µl tissues were detected in the trachea, nose, BALF, nasal pharyngeal lavage fluid, blood and pulmonary lymph node during SARS-CoV-2 infection. (e) The SARS-CoV-2 virus titres were detected in the trachea, nose, BALF, nasal pharyngeal lavage fluid, blood and pulmonary lymph node during SARS-CoV-2 infection. And the data were shown by log10 of CCID50 per 1 g or 1 ml tissues. (f) HE staining detection and IHC and IF by anti-SARS-CoV-2 nucleocapsid antibody in the lung of the mice on 3 dpi after infection with SARS-CoV-2, and the images in HE stains and IHC were captured from two continuous slides from the same lobe of the lung. The scales in HE and IHC were 50 µm, and the magnification factors were 20×; the scale was 10 µm, and the magnification factors were 630×. n = 3 in every point and the data were analysed using GraphPad Prism 8.
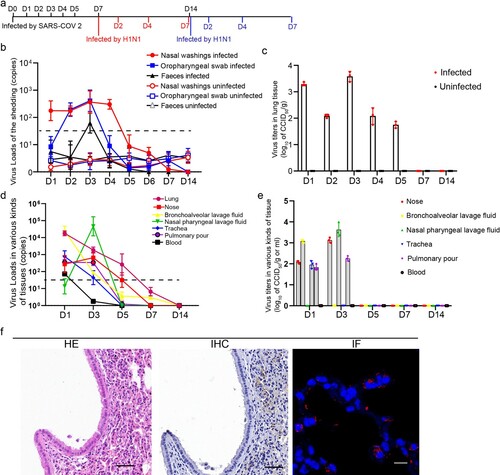
Figure 2. SARS-CoV-2 infection disturbed the balance of lymphocytes in PBMC and lung. (a) The proportions of CD3 and CD19 cells in PBMC and lung were analysed in the SARS-CoV-2-infected mice and uninfected mice. (b) The proportions of Th17 and Th1 cells in PBMC and lung were analysed in the SARS-CoV-2-infected mice and uninfected mice. (c) The proportions of Th2 and TREG cells in PBMC and lung were analysed in the SARS-CoV-2-infected mice and uninfected mice. (d) The proportions of innate lymphocytes including neutrophil granulocytes, macrophages and NK cells in PBMC and lung were analysed in the SARS-CoV-2-infected mice and uninfected mice. (e) CD4+ SARS-CoV-2-Spike-tetramer positive cells in PBMC were analysed during SARS-CoV-2 infection. n = 3 in every point and the data were analysed using GraphPad Prism 8.
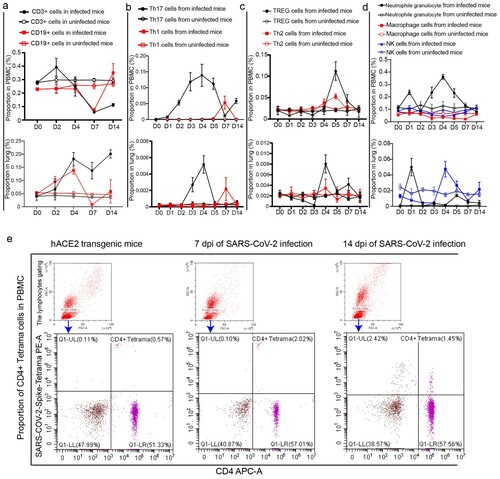
Figure 3. H1N1 infection was enhanced during rehabilitation from SARS-CoV-2 infection. (a) Weight changes in mice after challenged with H1N1, and the data were shown by change percentages. (b,c) The virus loads of H1N1 shedding in the nose (b) and oropharynx (c) were detected in the mice upon H1N1 exposure on 7 and 14 dpi with SARS-CoV-2 and in the mice without SARS-CoV-2 infection. The samples were from 20 µl nasal washings and whole oropharynx swabs, and the data were shown by cycle threshold (Ct) in the RT-real-time PCR. (d,e) The virus loads in the lung (d) and trachea (e) of the mice upon H1N1 exposure on 7 and 14 dpi with SARS-CoV-2 and in the mice without SARS-CoV-2 infection. The samples were from 100 mg tissues, and the data were shown by Ct in the RT-real-time PCR. (f) The virus loads on 4 dpi in the nose, pulmonary lymph node, small intestine and spleen of the mice upon H1N1 exposure on 7 and 14 dpi with SARS-CoV-2 and in the mice without SARS-CoV-2 infection. The samples were from 100 mg tissues, and the data were shown by Ct in the RT-real-time PCR. n = 3 in every point and the data were analysed using GraphPad Prism 8, and the P-values were calculated by one-way ANOVA using SPSS PASW statistical software version 18.0. *0.01 < P ≤ 0.05, **0.001 < P ≤ 0.01, and ***P ≤ 0.001.
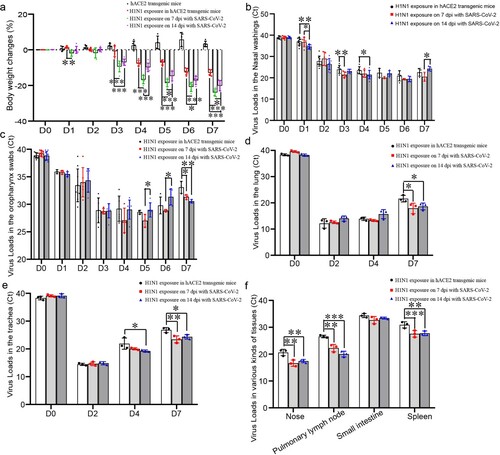
Figure 4. Lung injury by subsequent H1N1 infection was enhanced in the SARS-CoV-2 infection convalescent stage. (a) The lung injury by subsequent H1N1 infection were detected by HE staining, and in the early stage, inflammatory cells infiltrated around bronchioles or blood vessels, and then the cells in bronchi began to die and occlude the bronchi, in the last phase, large areas of pulmonary stroma were substantial lesions with inflammatory cell infiltration and alveolar cell shedding and death, and in the lungs of the mice without SARS-CoV-2 infection, the areas of substantial lesions were smaller than those in the mice infected with SARS-CoV-2 for 7 and 14 days. In addition, some alveolar septal cells thickened in the mice that had been infected with SARS-CoV-2. (b) Scoring of histopathological changes to quantify the lung injury, including Pulmonary oedema scores, Alveolar infiltration scores and Bronchia infiltration scores. The Histology score standards were in sTable 1. n = 3 in every point and the data were analysed using GraphPad Prism 8, and the P-values were calculated by one-way ANOVA using SPSS PASW statistical software version 18.0. *0.01 < P ≤ 0.05, **0.001 < P ≤ 0.01 and ***P ≤ 0.001.
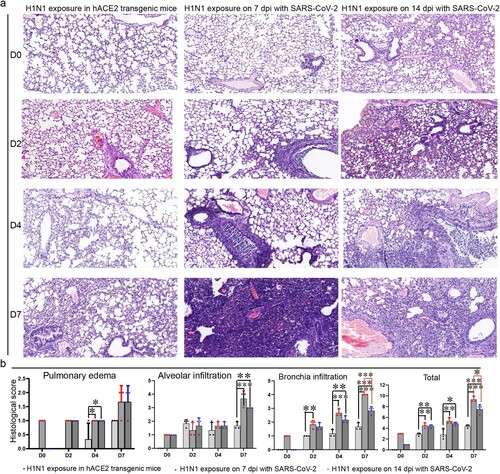
Figure 5. The abundance of inflammatory cytokines and chemokines by subsequent H1N1 infection in SARS-CoV-2 infection convalescent stage were enhanced The abundance of inflammatory cytokines and chemokines by subsequent H1N1 infection were detected by RT-real-time PCR in the four groups of mice including the mice upon H1N1 exposure on 7 and 14 dpi of SARS-CoV-2 infection and in the mice without SARS-CoV-2 infection was detected during H1N1 infection, the abundance of inflammatory cytokines and chemokines were also detected in the uninfected mice. The samples were from 100 mg tissues, and the data were shown by the fold changes of the abundance. Twenty-one kinds of inflammatory cytokines and chemokines were performed, including IL-12, IL-17, IL-22, IL-33, MMP9, MIP1-α, PANTES, IFN-β, IFN-γ, IL-2, IL-4, IL-10, IL-6, MCP-1, CXCL-2, CXCL-13, IL-1 β, CXCL-1, CXCL-5, TNF-α and GM-CSF, and the primer sequences were presented in sTable 2. n = 3 in every point and the data were analysed using GraphPad Prism 8.
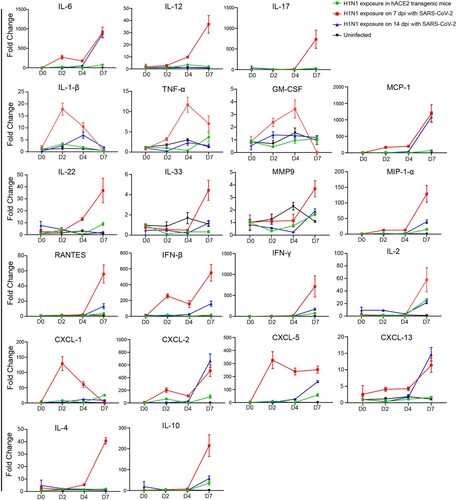
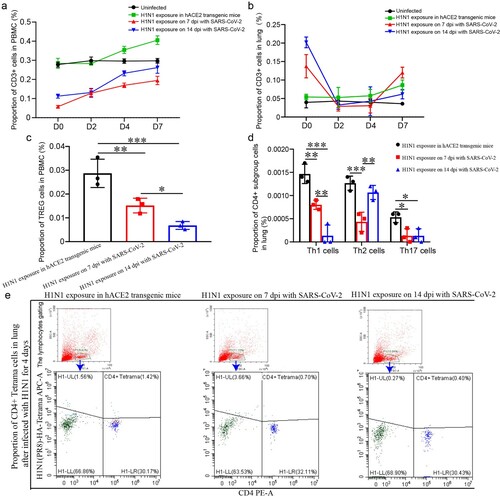
Figure 6. The levels of T cell responses were lower in PBMC and lung upon H1N1 infection during the convalescent stage of SARS-CoV-2 infection (a, b) CD3 cells in PBMC (a) and lung (b) in the mice upon H1N1 exposure on 7 and 14 dpi of SARS-CoV-2 infection and in the mice without SARS-CoV-2 infection were detected during H1N1 infection. The data were shown by percentages. (c) The level of TREG cells in PBMC on 4 dpi after H1N1 infection in the mice upon H1N1 exposure on 7 and 14 dpi of SARS-CoV-2 infection and in the mice without SARS-CoV-2 infection were showed. The data were shown by percentages. (d) The levels of Th17 cells, Th1 cells and Th2 cells in the lung on 4 dpi in the mice upon H1N1 exposure on 7 and 14 dpi of SARS-CoV-2 infection and in the mice without SARS-CoV-2 infection were showed. The data were shown by percentages. (e) CD4+ H1N1-HA-tetramer cells in lung of the mice upon H1N1 exposure on 7 and 14 dpi of SARS-CoV-2 infection and in the mice without SARS-CoV-2 infection were showed. n = 3 in every point and the data were analysed using GraphPad Prism 8, and the P-values were calculated by one-way ANOVA using SPSS PASW statistical software version 18.0. *0.01 < P ≤ 0.05, **0.001 < P ≤ 0.01, and ***P ≤ 0.001.