
Figures & data
Figure 1. Bivariate analysis identifies species-specific transcriptomes prior to and following infection. (A) Principal component analysis of cynomolgus or rhesus macaques uninfected or infected with EBOV-Makona Guinea C07. (B) Venn diagram of DEGs detected in infected macaque species (4 and 6 days post infection) relative to uninfected counterparts. (C) GO enrichment depicting functional enrichment of DEGs found in Figure S1E using Metascape. The colour intensity represents the statistical significance, as shown by the negative log of the FDR-adjusted p-value (-log(q-value)), with the range of colours based on the GO terms with lowest and highest -log(q-value) values for the entire set of GO terms. Numbers of DEGs enriching to each GO term per column are represented in each box; blank boxes represent no statistical significance. Gene expression heatmaps representing DEGs from GO terms found in part C: (D) “response to virus” and “type I interferon production,” (E,F) “myeloid leukocyte activation” and (G) “lymphocyte activation.” Heatmaps represent DEGs either common to both or unique to one species. Each column represents the median of the normalized rpkm of samples. Range of colours is based on scaled and centred rpkm values of the represented DEGs. Red represents upregulated; blue represents downregulated. DEGs expressed to a greater extent in cynomolgus (orange) or rhesus (green) macaques are coloured (two-tailed T test).
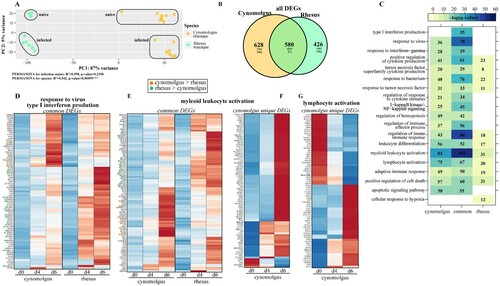
Figure 2. EBOV infection results in species-specific transcriptomes. (A) Sparse partial least squares discrimination analysis (SPLS-DA) of EBOV-infected and uninfected cynomolgus or rhesus macaques. (B) 130 gene sufficient to resolve transcriptional differences in part A. Weight loadings are coloured by group, where greater weight represents greater correlation with the infection state. (C) GO network depicting functional enrichment of 130 genes identified in part B. Clustered nodes of identical colour correspond to one GO term. Node size represents the number of genes associated with the GO term. Grey lines represent shared interactions between GO terms, with density and number indicating the strengths of connections between closely related GO terms. Accompanying graph illustrates the significance (negative log of the FDR-adjusted p-value (-log(q-value))) and number of genes associated with each GO term. (D) Heatmap representing 130 genes identified in part B. Each column represents the median of the normalized rpkm of samples. Range of colours is based on scaled and centred rpkm values of the represented DEGs. Red represents upregulated; blue represents downregulated.
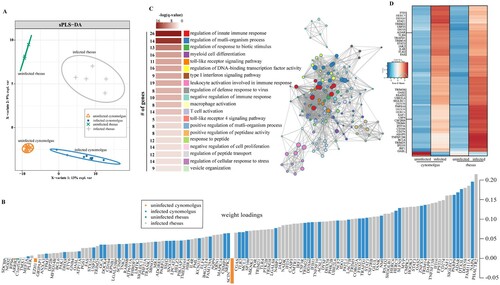
Figure 3. Cynomolgus and rhesus macaques share a core of EVD-related genes. (A) Volcano plot of global gene expression changes shared between infected cynomolgus and rhesus macaques. DEGs (average rpkm ≥5) are denoted in red. Exemplar DEGs are labelled. (B) GO network depicting functional enrichment of DEGs expressed by both infected rhesus and cynomolgus using Metascape. Clustered nodes of identical colour correspond to one GO term. Node size represents the number of DEGs associated with the GO term. Grey lines represent shared interactions between GO terms, with density and number indicating the strengths of connections between closely related GO terms. Heatmaps representing DEGs enriching to GO terms (C) “response to virus,” “regulation of production of type I interferon,” “interferon-gamma-mediated signaling pathway,” (D) “lymphocyte activation,” (E) “myeloid cell activation,” “myeloid cell differentiation,” (F) “apoptotic signaling pathway” depicted in part B. Where GO terms consisted of more than 60 DEGs, only 60 are represented. Each column represents the median of the normalized rpkm of samples. Range of colours is based on scaled and centred rpkm values of the represented DEGs. Red represents upregulated; blue represents downregulated. DEGs expressed to a greater extent in cynomolgus (orange) or rhesus (green) macaques are coloured (two-tailed T test).
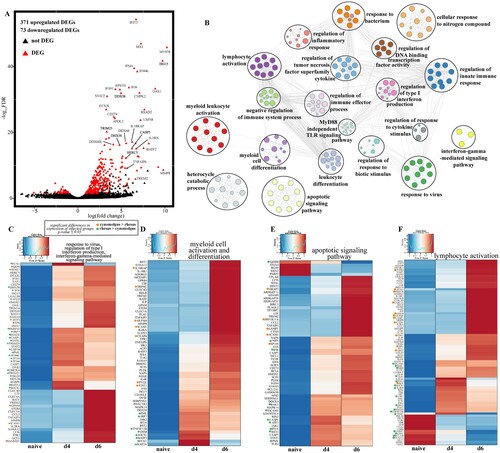
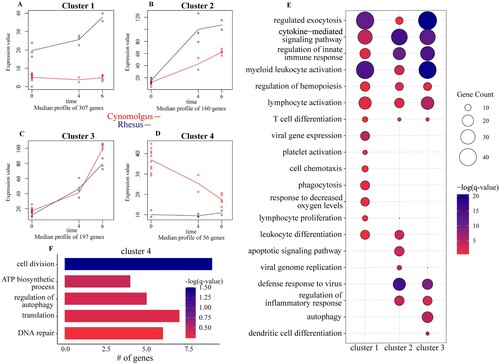
Figure 4. Regression analysis determines longitudinally regulated genes distinctly regulated by each species. (A-D) Gene expression of the four uniquely-regulated gene clusters identified by MaSigPro using a two-ways forward regression strategy. (E) Bubbleplot representing functional enrichment of genes belonging to clusters 1–3 during infection (4 and 6 DPI). Colour intensity of each bubble represents the negative log of the FDR-adjusted p-value (-log(q-value)) and the relative size of each bubble represents the number of DEGs belonging to the specified Gene Ontology (GO) term. (F) GO term bar graph representing functional enrichment of genes belong to cluster 4 during infection. Colour intensity of each bar represents the -log(q-value) for the corresponding GO term.
Supplemental Material
Download Zip (2.4 MB)Data availability
Sequencing data for rhesus macaques is available at BioProject PRJNA718880. Sequencing data for cynomolgus macaques is available at BioProject PRJNA398558.