
Figures & data
Figure 1. B. pertussis strain characterization. Protein levels of (a) Prn, (b) Vag8, (c) Ptx and (d) FHA were determined for all nine B. pertussis strains using whole-cell ELISA. (e) TLR2 and (f) TLR4 activation in HEK blue cell lines with the nine live B. pertussis strains (MOI 40) or their respective ligands, PAM3CSK4 (100 ng/ml) for TLR2 and LPS-EK (10 ng/ml) for TLR4. The represented SEAP activity is normalized against the SEAP activity induced by the respective TLR ligands. Dots indicate individual measurements. Colours in dots indicate different B. pertussis strains (Table S1): A = dark purple, B = purple, D = light purple, F = dark green, G = green, H = light green, J = dark grey-green, K = grey-green, L = light grey-green. Data is representative of at least 3 independent experiments.
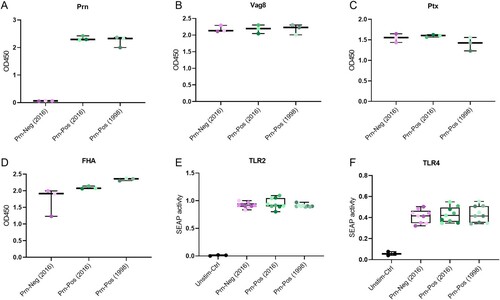
Figure 2. Increased cytokine secretion of moDCs stimulated with Prn-Neg B. pertussis strains compared to the stimulation with Prn-Pos strains. moDCs cytokine secretion was measured after stimulation with strains A, B, D (Prn-Neg (2016)), F, G, H (Prn-Pos (2016)), J, K or L (Prn-Pos (1998)), or untreated controls (Unstim-Ctrl) for 24 h. Cytokine values in y axes were normalized against the mean of all measured concentrations of that cytokine. Dots indicate individual donors. Colours in dots indicate different B. pertussis strains (Table S1): A = dark purple, B = purple, D = light purple, F = dark green, G = green, H = light green, J = dark grey-green, K = grey-green, L = light grey-green. Results are represented as boxplots showing normalized cytokine levels. **p < 0.01, ***p < 0.001, ****p < 0.0001. Significance is represented when the effect size is ≥Medium (Table S7).
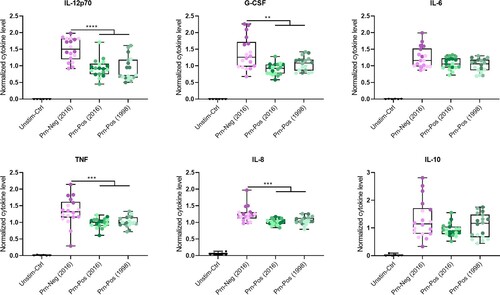
Figure 3. Distinct gene expression profile in Prn-Neg stimulated moDCs. (a) moDCs were unstimulated (black) or stimulated with 3 different Prn-Neg B. pertussis strains (purple) and 6 Prn-Pos B. pertussis strains (dark green, isolated in 2016; light green, isolated in 1998). Normalized corrected read counts from all RNAseq genes were analyzed with PCA. (b) Gene set enrichment analysis (GSEA) of B. pertussis-stimulated moDCs. Green bars represent pathways enriched in Prn-Pos, purple bars represent enrichment in Prn-Neg stimulated moDCs. (c, d) Protein-protein interaction clusters of all genes included in GSEA pathways from (b), of moDCs after (c) Prn-Neg (purple) or (d) Prn-Pos (green) stimulation; DEG, differentially expressed genes (padj < 0.05, Fold Change > ±1.2) between Prn-Pos and Prn-Neg stimulated moDCs; EMT, epithelial to mensenchymal transition.
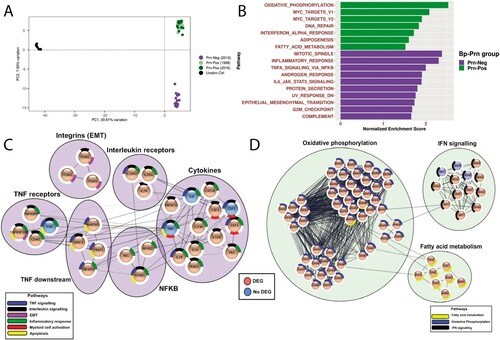
Figure 4. DC associated Blood Transcription Modules (BTM) confirmed an over-representation of immune activated genes for Prn-Neg stimulated moDCs compared to the stimulation with Prn-Pos strains. Heatmap representing a hierarchical clustering of all DC associated BTM gene counts (rows; z-scores, scaled and centered per gene) per individual moDC donors, stimulated with different B. pertussis strains (columns, Unstim-Ctrl moDCs (black); Prn-Pos (green) and Prn-Neg (purple) stimulated moDCs). BTM labeling represents genes associated with “Resting” (blue) or “Activated” (red) DC-related BTMs; DEG labeling, differentially expressed genes (padj < 0.05, Fold Change > ±1.2) between Prn-Pos and Prn-Neg stimulated moDCs. An educated selection of important immune related genes is shown in rows for better visualization. For a complete list, see Table S5.
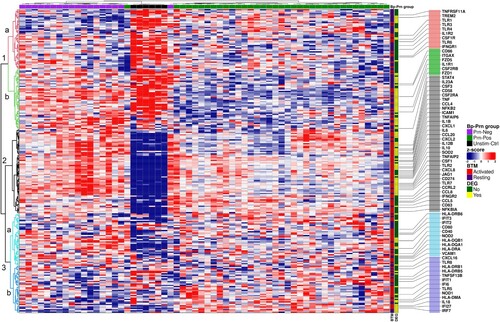
Figure 5. Protein expression analysis with LC-MS showed a differential proteomic profile between B. pertussis Prn-Neg and Prn-Pos strains apart from pertactin deficiency. (a) Heatmap representing a hierarchical clustering of the protein expression (z-scores, scaled and centered per protein) from the top 100 most variable proteins (rows) per individual B. pertussis strains (columns). DEP labeling indicates significant differentially expressed proteins (padj < 0.05, Fold change > ±1.5). Virulence labeling indicates whether the protein is defined as Bvg-regulated according to Streefland et al. [Citation42]. (b) Volcano plot of DEPs upregulated in Prn-Pos (green squared proteins) and in Prn-Neg (purple squared proteins) B. pertussis strains. Red dots represent DEPs (padj < 0.05, Fold change > ±1.5); grey dots represent proteins above the padj = 0.1 cut off but below the padj = 0.05 and/or 1.5 fold change cut off; black dots represent proteins below the padj = 0.1 cut off.
![Figure 5. Protein expression analysis with LC-MS showed a differential proteomic profile between B. pertussis Prn-Neg and Prn-Pos strains apart from pertactin deficiency. (a) Heatmap representing a hierarchical clustering of the protein expression (z-scores, scaled and centered per protein) from the top 100 most variable proteins (rows) per individual B. pertussis strains (columns). DEP labeling indicates significant differentially expressed proteins (padj < 0.05, Fold change > ±1.5). Virulence labeling indicates whether the protein is defined as Bvg-regulated according to Streefland et al. [Citation42]. (b) Volcano plot of DEPs upregulated in Prn-Pos (green squared proteins) and in Prn-Neg (purple squared proteins) B. pertussis strains. Red dots represent DEPs (padj < 0.05, Fold change > ±1.5); grey dots represent proteins above the padj = 0.1 cut off but below the padj = 0.05 and/or 1.5 fold change cut off; black dots represent proteins below the padj = 0.1 cut off.](/cms/asset/3e056d1b-edb3-44c7-9816-28a939d121a9/temi_a_1943537_f0005_oc.jpg)
Supplementary_materials_Kroes_et_al_for_submission_EMaI_Revised.docx
Download MS Word (30.4 KB)Data availability statement
All RNAseq data is available in the GEO database, accession number: GSE164643.