
Figures & data
Figure 1. The evolution of the global 325 ST37 genomes through time was oriented by using a geotemporal model. Six major lineages were defined as lineages I–VI. C. difficile ST37 strains from China were clustered into four sublineages (CSL). Terminal nodes were coloured according to different countries or regions. The X axis was the isolation year. Coloured bars to the right of the phylogeny indicate the presence of 12 putative antibiotic resistance genes and 17 antibiotic resistance associated genes with different amino acid substitutions. The presence of the five tetM alleles (tetM 10, 15, 21, 40 and 59) was indicated by the coloured bars to the column of tetM.
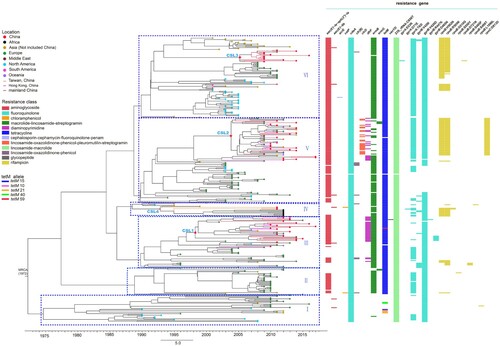
Figure 2. Bayesian evolutionary analysis of 48 sequenced ST37 isolates showed the three major sublineages corresponding to CSL1, CSL2 and CSL3, respectively. Terminal nodes were coloured according to different countries or regions. The X axis was the isolation year. A total of 12 antibiotic resistance phenotype were listed on the right (red: resistance; green: susceptible; orange: intermediate). metronidazole (MTZ), vancomycin (VAN), clindamycin (CLI), erythromycin (ERY), fusidic acid (FuA), rifampicin (RIF), levofloxacin (LFX), moxifloxacin (MFX), gatifloxacin (GAT), tetracycline (TET), piperacillin/tazobactam (PIP-TAZ), and ciprofloxacin (CFX). The colours from light to dark were on behalf of CDI severity shown in the middle part.
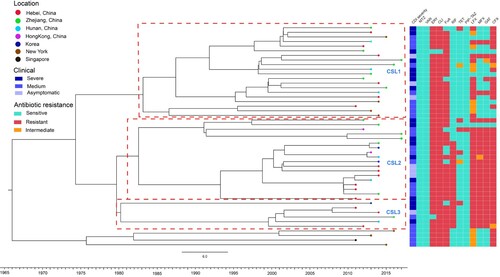
Figure 3. Transmission events inferred for Chinese ST37 by Bayesian evolutionary analysis. (a) Global spread (blue arrows) of Chinese ST37 inferred by phylogeographic analysis. (b) Pink arrows showed transmission routes of ST37 isolates into and within China based on phylogeographic analysis.
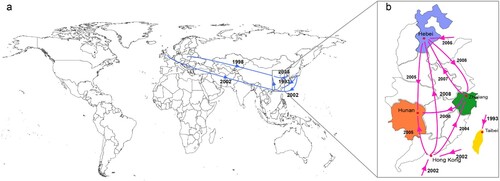
Table 1. The MICs for 12 antibiotic agents against the 48 isolates involved in this study.
Figure 4. The toxin concentration and sporulation capacity were shown as the means ± standard deviation. Significant differences were marked with **P < 0.05. Comparison of the sporulation determination (a) and toxin B production (b) among the isolates with different clinical symptoms. “●”, “▪” and “▴” represented the average value of three parallel experiments for each strain, respectively.
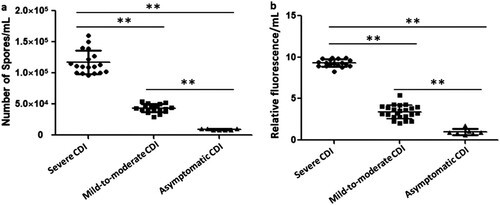
Table 2. Clinical information of the 48 patients involved in this study.
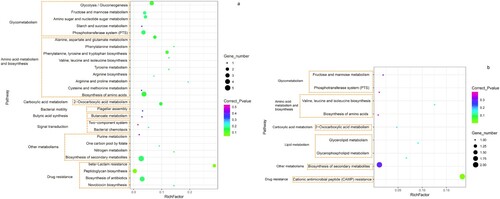
Figure 5. The enriched Kyoto Encyclopedia of Genes and Genomes (KEGG) molecular pathways for genes with mutations among isolates associated with severe CDI. (a) Statistics of enriched pathways involved in the SNPs specific to severe CDI. (b) Statistics of enriched pathways involved in the indels specific to severe CDI. The X- axis was the rich factor. The Y-axis was the enriched pathways with gene functions listed on the left. Coloured dots represented corrected P value and the size of black dots indicated the number of genes involved in the metabolic pathway.
Supplemental Material
Download MS Word (4.4 MB)Data availability statement
Data of 277 ST37 genomes are available in NCBI database under Bioproject numbers ERP009770 and PRJEB11868. The genomic data of the 48 isolates sequenced in this study were deposited in the NCBI database under study accession number PRJNA591265. The reference genome of C. difficile M68 can be found under GenBank FN668375. The Eleven completely assembled and fully annotated C. difficile genomes can be found as Table S1.