
Figures & data
Figure 1. Infection efficiency of low-dose SARS-CoV-2 aerosol and fomite exposure. (a) Relative weight in hamsters after SARS-CoV-2 inoculation via the aerosol route with 1.1 × 10² or 2.5 × 101 TCID50 (indicated as Aerosol 102 and 101) or fomite route with 103, 102 and 101 TCID50 (indicated as Fomite 103, 102 and 101) of hCoV-19/human/USA/WA-CDC-WA1/2020 (WA1, lineage A), (N = 4 per group). Symbols show mean and error bars show standard error of the mean (SEM). (b) Viral load in oropharyngeal swabs of individual animals. (c) Area under the curve (AUC) analysis of sgRNA detected in oropharyngeal swabs throughout the experiment. The lines represent the median. (d) Binding antibodies against spike protein of SARS-CoV-2 in serum obtained at 14 days post inoculation.
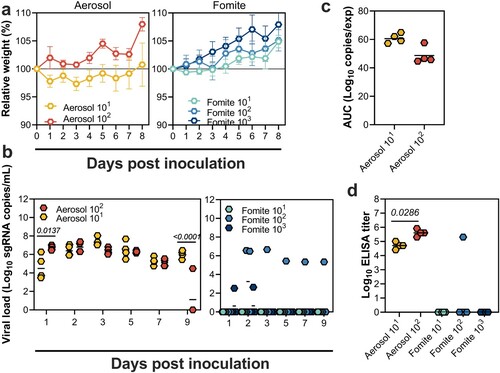
Figure 2. Heterologous B.1.351 challenge following SARS-CoV-2 lineage A exposure. (a) Relative weight in hamsters after 8 × 10⁴ TCID50 VOC B.1.351 intranasal rechallenge over time (DPR = day post rechallenge) for the seroconverted animals (N = 9) and non-seroconverted animals (N = 2). Symbols show mean and error bars show standard error of the mean (SEM). (b) Viral load in oropharyngeal swabs from individual rechallenged animals. Line represents median. (c) Area under the curve (AUC) analysis of shedding as measured by viral load in swabs. Line represents median. (d) Lung:body weight ratio (mg/g) of hamsters euthanized at 5 DPR. Line represents median. (e) Infectious virus titre in lung tissue obtained at 5 DPR. Line represents median, dotted line represents limit of detection. (f) Binding antibodies against spike protein of SARS-CoV-2 in serum obtained 14 DPR. (g) Left panel: Virus neutralizing antibody titres against lineage A and VOC B.1.351. Right panel: Virus neutralizing antibody titres against lineage A and VOC B.1.351 in serum obtained from seroconverted animals after VOC B.1.351 rechallenge.
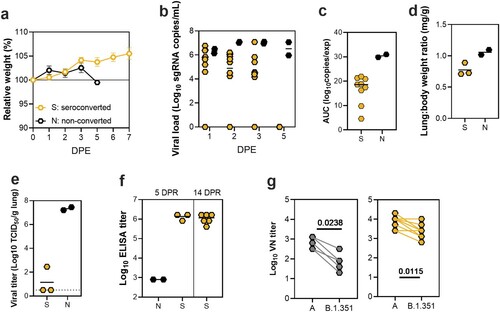
Figure 3. Lung pathology after heterologous B.1.351 rechallenge. Comparison of SARS-CoV-2 pathology for seroconverted and non-seroconverted hamsters at 5 days post rechallenge (DPR). (a–d) HE 1×. Lungs of seroconverted hamsters (a and b) and non-seroconverted hamsters (c and d), lung tissue from seroconverted animals was normal whereas the non-seroconverted animals displayed pathology consistent of lower respiratory tract infection with SARS-CoV-2. (e–h) HE 100×. Normal lungs from seroconverted hamsters (e and f) and lungs from non-seroconverted hamsters demonstrated alveolar inflammation consisting of macrophages and neutrophils, as well as variable amounts of hemorrhage, fibrin and edema (g and h). (i–l) IHC staining against N protein SARS-CoV-2 (SARS-CoV-2 antigen is visible as red-brown staining), 100×. SARS-CoV-2 antigen is absent from lungs of the seroconverted hamsters (i and j) whereas lungs from non-seroconverted hamsters demonstrated viral antigen in bronchial and bronchiolar epithelium, type I and II pneumocytes as well as pulmonary macrophages (k and l). Scale bar indicates 50 µm.
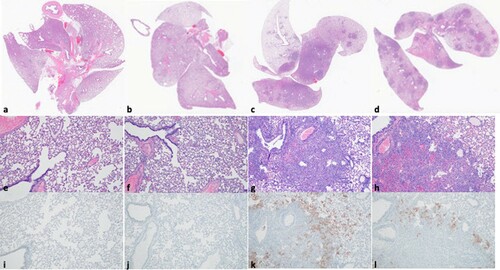
Figure 4. Hamsters rechallenged with VOC B.1.351 do not transmit SARS-CoV-2 to naïve sentinels. VOC B.1.351 rechallenged animals were co-housed with a naïve sentinel (1:1 ratio) in a new cage for 24 h at 2 DPR. (a) Viral load of individual exposed sentinel animals measured by sgRNA in oropharyngeal swabs days post exposure (DPE). (b) Infectious virus titre of individual animals in oropharyngeal swabs from rechallenged animals. Dotted line = limit of detection.
Table 1. Presence of SARS-CoV-2 spike IgG antibodies in sentinels co-housed with B.1.351 rechallenged hamsters in serum obtained 14 days post contact. negative (–): optical density (at 450 nm) < 0.124, positive (+) optical density (at 450 nm) ≥ 0.124.