
Figures & data
Figure 1. WGS SNP and resistance gene mutation analysis of 115 invasive, environmental and colonizing South African Candida auris strains collected between 2009 and 2018 during national laboratory-based candidemia and Candida auris surveillance, an environmental survey and a neonatal unit outbreak. There were 211 626 SNPs in total with a coverage breadth of 62% and this is an unrooted maximum parsimony tree with 500 bootstrap replicates. The consistency index was 0.89 and the number of phylogenetic sites were 211 626. Circles represent invasive isolates, red squares represent colonizing strains and the green square represents the one isolate from urine in 2018. The red triangles represent the environmental strains and the light blue star represents the first C. auris strain isolated in 2009.
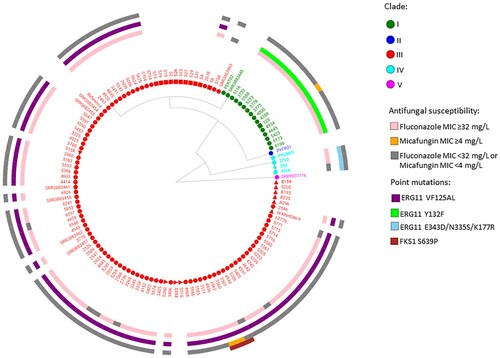
Table 1. Characteristics of 98 South African patients infected or colonized with Candida auris strains sequenced in this study.
Figure 2. Epidemic curve of cases of Candida auris bloodstream infection by clade (I – green, III – red, IV – blue and not sequenced – grey) and collection date (2016–2017).
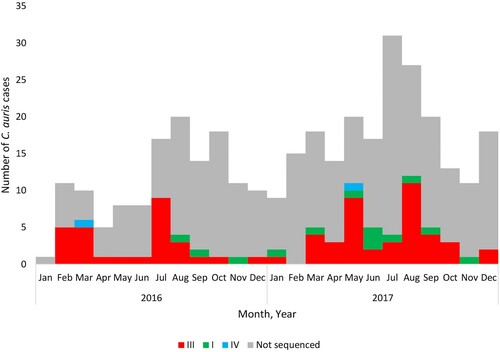
Figure 3. Epidemic curve of cases of Candida auris bloodstream infection by clade (I – green, III – red, IV – blue and not sequenced – grey) and acute-care hospital facility (collection dates: 2016–2017).
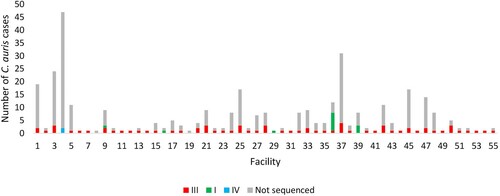
Table 2. Antifungal susceptibility distribution of Candida auris strains within clade III collected during the 2016–2017 national laboratory-based surveillance for candidemia, n = 77.
Table 3. Antifungal susceptibility distribution of Candida auris strains within clades I (n = 14) and IV (n = 3) from this study.
Table 4. Proportion of fluconazole-resistant and micafungin-resistant Candida auris strains with resistance gene mutations by clade from this study.