Figures & data
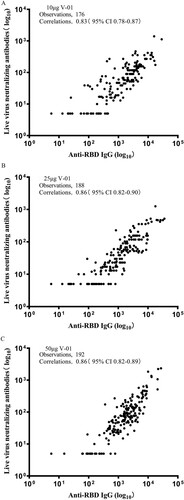
Figure 1. Trial flow diagram.
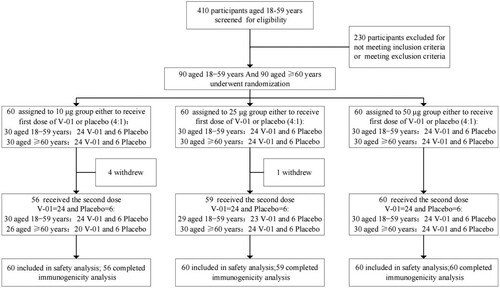
Table 1. Baseline characteristics of the participants classified by age.
Table 2. AEs in Phase 1 trial.
Figure 2. Humoral immune responses in phase I trials. GMTs (A) and seroconversion rates (B) of neutralizing antibodies at different timepoints after first vaccination in phase 1. GMTs (C) and seroconversion rates (D) of RBD-binding antibodies at different timepoints after first vaccination in phase 1. Error bars represent 95% CIs of geomeans. The horizontal dashed lines in panels A and C indicate the limit of detection. RBD: receptor-binding domain.
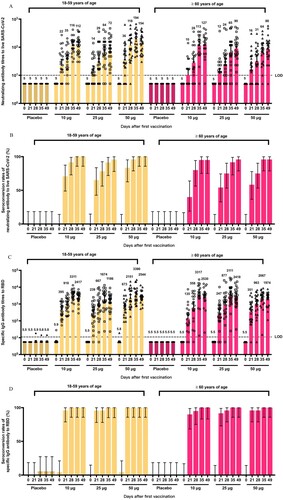
Figure 3. Correlation of live virus neutralizing antibodies and anti-RBD IgG binding antibody response. Scatter plots of log10 transformed live SARS-COV-2 neutralizing antibody responses and anti-RBD IgG binding antibody responses at day 21 (immediately before the second dose), day 28 (1 week after the second vaccination), day 35 and day 49 in the 10 (A), 25 (B), and 50 μg (C) V-01 group.