Figures & data
Figure 1. DNA-ZIKV vector express ZIKV E protein. (A) HEK-293T cells were transfected with 5µg of pCIneo-ZIKV (DNA-ZIKV) or empty pCIneo-ϕ vectors. At 48 h post-transfection, cell extracts were analysed by Western blot against ZIKV E. Arrow on the right indicate the position of the ZIKV E protein. The sizes of standards (in kDa) are indicated on the left. (B) Expression of ZIKV E from a stable cell line of transfected HeLa cells. Transfected or untransfected control cells were fixed, permeabilized and ZIKV E protein was detected using 4G2 antibody and Alexa Fluor 488 secondary antibodies. The expression of ZIKV E in the stable HeLa cell clone was analysed by flow cytometry. (C) Immunofluorescence analysis of ZIKV E expression in a cell clone of HeLa cells transfected with DNA-ZIKV. Zika virus E (green) was detected as described in (B) and the endoplasmic reticulum was detected using rabbit anti-Calnexin antibodies and Alexa Fluor-594 (red) secondary antibodies. Scale bar: 20 µm. (D) Enzyme-linked immunodot assay using 4G2 monoclonal antibody of culture supernatants from a HeLa cell clone transfected with DNA-ZIKV. Culture medium from untransfected HeLa cells was included as a negative control. (E) Purification of ZIKV VLPs from the supernatant of a HeLa cell clone transfected with DNA-ZIKV by sucrose density gradient ultracentrifugation. A280 denotes the amount of protein determined by spectrophotometry (absorbance at 280 nm) in fractions obtained after ultracentrifugation of concentrated supernatants loaded into a 20–60% w/v sucrose gradient. Sucrose density was also determined by refractometry of each fraction.
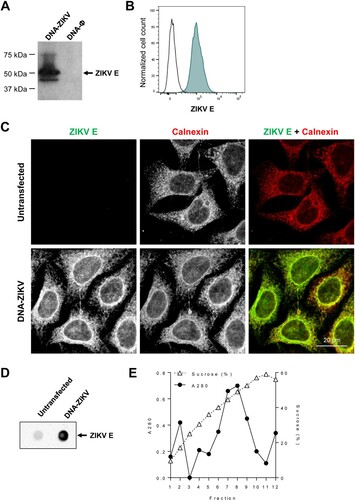
Figure 2. Immunization schedule. Five groups of female BALB/c mice (6–8 weeks old) were homologous or heterologous vaccinated as follows: MVA-ZIKV/MVA-ZIKV, DNA-ZIKV/DNA-ZIKV, DNA-ZIKV/MVA-ZIKV, MVA-WT/MVA-WT and DNA-ϕ/DNA-ϕ. Animals (n = 8/group) received 100 μg of DNA vector (pCIneo-ZIKV or pCIneo-ϕ in the control group) or 2 × 10⁷ PFU of the corresponding MVA virus (MVA-ZIKV, or MVA-WT for control group) by bilateral intramuscular (i.m.) route. Two weeks later animals were boosted by the same i.m. route with 100 μg of the corresponding DNA vectors or 2 × 10⁷ PFU of the corresponding MVA virus. At 10 and 53 days after the last immunization, 4 mice in each group were sacrificed with carbon dioxide (CO2). Their spleens and popliteal lymph nodes were processed to measure cellular immune responses to ZIKV antigens by intracellular cytokine staining (ICS) assay and their sera harvested and used to analyse humoral immune responses.
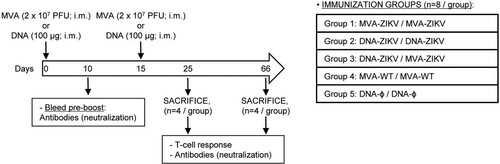
Figure 3. Adaptive ZIKV-specific CD4+ and CD8+ T cell immune responses in immunized mice. Splenocytes were collected from mice (n = 4 per group) immunized with MVA-ZIKV/MVA-ZIKV, DNA-ZIKV/DNA-ZIKV, DNA-ZIKV/MVA-ZIKV, MVA-WT/MVA-WT and DNA-ϕ/ DNA-ϕ, 10 days after the last immunization. Next, ZIKV-specific CD4+ and CD8+ T cell adaptive immune responses triggered by the different immunization groups were measured by ICS assay following the stimulation of splenocytes with an ZIKV E peptide pool. Values from unstimulated controls were subtracted in all cases. (A and B) Magnitude of the total ZIKV-specific CD4+ (A) and CD8+ (B) T cell responses after stimulation of splenocytes with the ZIKV E peptide pool. The total value in each group represents the sum of the percentages of CD4+ and CD8+ T cells expressing CD107a and/or producing IFN-γ and/or IL-2 and/or TNF-α against ZIKV E peptide pool. (C and D) Polyfunctionality of the ZIKV-specific CD4+ (C) and CD8+ (D) T cell responses shown as the combined production of CD107a and/or IFN-γ and/or IL-2 and/or TNF-α against the ZIKV E peptide pool. p values indicate significant response differences between immunization groups (*** p < 0.001). Responses are grouped and colour coded on the basis of the number of functions (4, 3, 2, or 1). The pie charts summarize the data. Each slice corresponds to the proportion of the total ZIKV-specific CD4+ and CD8+ T cells exhibiting 1, 2, 3, or 4 functions (CD107a and/or IFN-γ and/or TNF-α and/or IL-2).
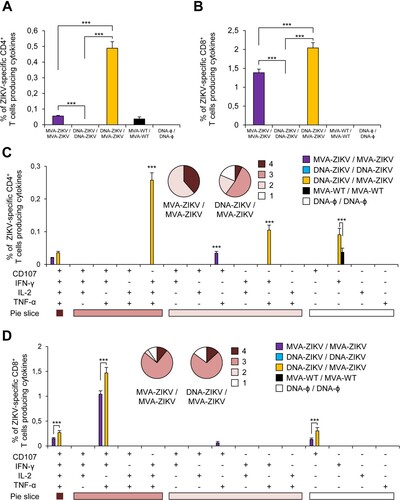
Figure 4. ZIKV-specific Tfh cell immune responses. Mice (n = 4) were immunized with MVA-ZIKV/MVA-ZIKV, DNA-ZIKV/DNA-ZIKV, DNA-ZIKV/MVA-ZIKV, MVA-WT/MVA-WT and DNA-ϕ/ DNA-ϕ. At 10 days after the last immunization, the magnitude of ZIKV-specific CD4+ Tfh cell immune response was studied in popliteal (draining) lymph nodes by ICS assay. The total value in each group represents the sum of the percentages of CD4+ Tfh cells expressing CD154 and/or producing IL-4 and/or IFN-γ against ZIKV E protein plus ZIKV E peptide pool. Data are background (RPMI)-subtracted. P values indicate significant response differences between immunization groups (***, p < 0.001).
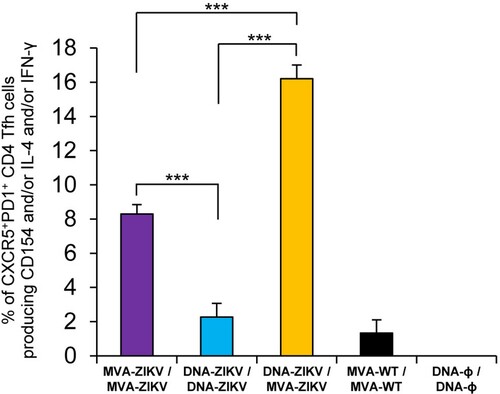
Figure 5. Memory ZIKV-specific CD4+ and CD8+ T cell immune responses in immunized mice. Splenocytes were collected from mice (n = 4 per group) immunized with MVA-ZIKV/MVA-ZIKV, DNA-ZIKV/DNA-ZIKV, DNA-ZIKV/MVA-ZIKV, MVA-WT/MVA-WT and DNA-ϕ/ DNA-ϕ, 53 days after the last immunization. Next, ZIKV-specific CD4+ and CD8+ T cell memory immune responses triggered by the different immunization groups were measured by ICS assay following the stimulation of splenocytes with a ZIKV E peptide pool. Values from unstimulated controls were subtracted in all cases. (A and B) Magnitude of the total ZIKV-specific CD4+ (A) and CD8+ (B) T cell responses after stimulation of splenocytes with the ZIKV E peptide pool. The total value in each group represents the sum of the percentages of CD4+ and CD8+ T cells expressing CD107a and/or secreting IFN-γ and/or IL-2 and/or TNF-α against ZIKV E peptide pool. (C and D) Polyfunctionality of the ZIKV-specific CD4+ (C) and CD8+ (D) T cell responses shown as the combined production of CD107a and/or IFN-γ and/or IL-2 and/or TNF-α against the ZIKV E peptide pool. p values indicate significant response differences between immunization groups (*** p < 0.001). Responses are grouped and colour coded on the basis of the number of functions (4, 3, 2, or 1). The pie charts summarize the data. Each slice corresponds to the proportion of the total ZIKV-specific CD4+ and CD8+ T cells exhibiting 1, 2, 3, or 4 functions (CD107a and/or IFN-γ and/or TNF-α and/or IL-2).
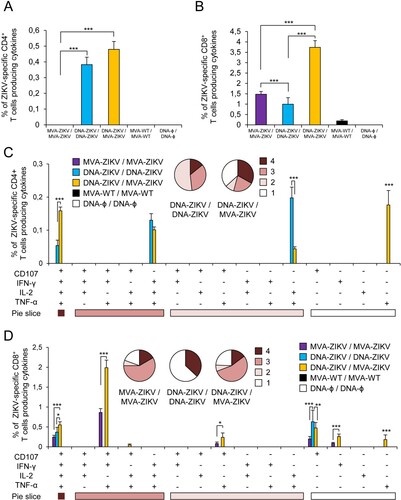
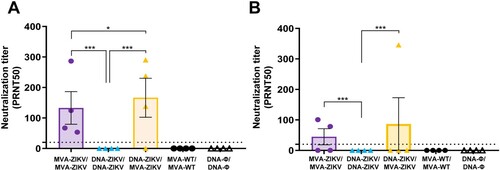
Figure 6. Induction of neutralizing antibodies by MVA-ZIKV in immunocompetent mice. Mice (n = 4) were immunized with MVA-ZIKV/MVA-ZIKV, DNA-ZIKV/DNA-ZIKV, DNA-ZIKV/MVA-ZIKV, MVA-WT/MVA-WT and DNA-ϕ/ DNA-ϕ and 10 (A) and 53 (B) days after the last immunization ZIKV-neutralizing antibody titters were analysed. Data represent the reciprocal of the serum dilution that inhibited plaque formation by 50% (PRNT50), relative to samples incubated with negative control sera. Dashed line indicates the limit of detection (LOD) of the neutralization assay (1/20 dilution).