Figures & data
Figure 1. Humoral immune responses induced by different vaccine platforms. (A) Schematic representation of experimental protocol and immunization groups. Mice in four groups were immunized with single dose of different COVID-19 vaccines: INA, rAd, rRBD and mRNA. (INA: inactivated vaccine, rAd: recombinant Ad5 vectored vaccine, rRBD: recombinant RBD vaccine, mRNA: mRNA-based vaccine). The dosages used for this experiment were 1/5 human dose for INA (0.8 μg), rRBD (10 μg), rAd (1 × 10¹⁰ vp) and mRNA (5 μg). (B, C). Sera NAb titres measured by live SARS-CoV-2 virus (B) and pseudovirus (C), the neutralizing antibody (NAb) concentrations were expressed as 50% inhibitory dilution (EC50) of serum. (D). Spike-specific binding IgG titres were measured by ELISA. (E). The titres of IgG subtypes were measured by ELISA, the ratios of IgG2a/IgG1 for each group were calculated and shown in chart. N = 10 per group, one spot represents one sample. One-way ANOVA was performed for B, C and D; two-tailed student’s t-test was performed for E. Bars represent the mean ± SEM, ****p < 0.0001.
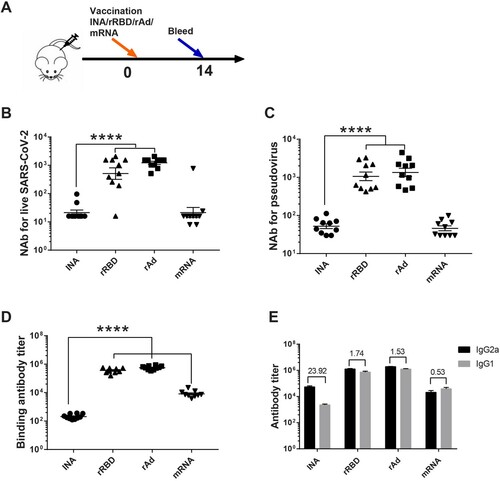
Figure 2. SARS-CoV-2 Spike-specific T cell responses induced by different vaccine platforms measured by INF-γ ELISPOT assay (A). Peptides spanning full length spike were synthesized and divided into four peptide pools: S1-non RBD (aa: 1-324, 577-654), S1-RBD (aa: 325-576), S2-1(aa: 655-960), S2-2(aa: 961-1273). (B). Mice were sacrificed for measuring T cell responses. Isolated lymphocytes were stimulated with 4 spike peptide pools, and the IFN-γ secreting cells were quantified by ELISPOT assay. N = 6 per group, one spot represents one sample. One-way ANOVA was performed for comparison. Bars represent the mean ± SEM, ns: p > 0.05, **p < 0.01, ***p < 0.001, ****p < 0.0001.
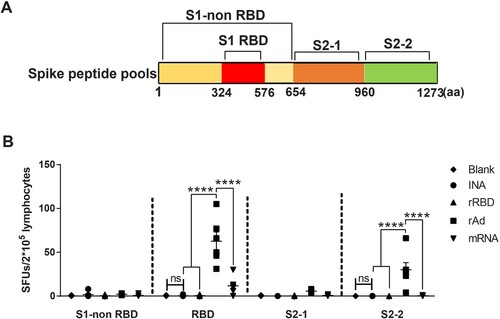
Figure 3. Humoral immune responses induced by homologous or heterologous prime boost regimens (A). Schematic representation of experimental protocol and immunization groups. Mice in six groups were immunized with different vaccines: INA*2 3w, INA*2, INA*3, INA*2 + rRBD, INA*2 + rAd, INA*2 + mRNA. (INA: inactivated vaccine, rAd: recombinant Ad5 vectored vaccine, rRBD: recombinant RBD vaccine, mRNA: mRNA-based vaccine). Blank control group were injected with PBS. (B, C). Sera NAb titres measured by live SARS-CoV-2 virus (B) and pseudovirus (C), the NAb titres were expressed as 50% inhibitory dilution (EC50) of serum. (D). Spike-specific binding IgG titres were measured by ELISA. (E). The titres of IgG subtypes were measured by ELISA, the ratios of IgG2a/IgG1 for each group were calculated and shown in chart. N = 8 per group, one spot represents one sample. One-way ANOVA was performed for B, C and D; two-tailed student’s t-test was performed for E. Bars represent the mean ± SD, ns: p > 0.05, *p < 0.05, **p < 0.01, ***p < 0.001, ****p < 0.0001.
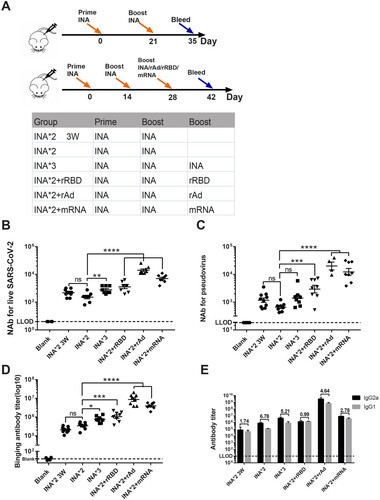
Figure 4. SARS-CoV-2 Spike-specific T cell responses induced by homologous and heterologous prime-boost regimens measured by INF-γ ELISPOT assay. Mice were sacrificed for measuring T cell responses. Isolated lymphocytes were stimulated with 4 spike peptide pools, and the IFN-γ secreting cells were quantified by ELISPOT assay. N = 6 per group, one spot represents one sample. One-way ANOVA was performed for comparison. Bars represent the mean ± SEM, ns: p > 0.05, ***p < 0.001, ****p < 0.0001.
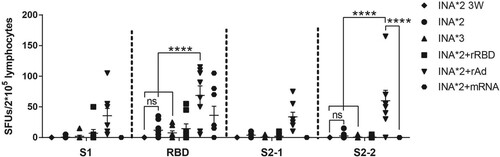
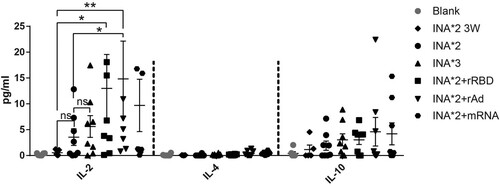
Figure 5. Multiplex cytokine analysis for homologous and heterologous prime-boost regimens. Lymphocytes isolated from mice kept on different immunization regimens were stimulated with 4 spike peptide pools. Supernatants were pooled by different groups or different peptide pools were collected. The IL-2, IL-4 and IL-10 in the supernatants were measured by MSD; the concentration of each cytokine (pg/ml) were represented by histogram. N = 6 per group. One-way ANOVA was performed for comparison. Bars represent the mean ± SEM, *p < 0.05, **p < 0.01, ns: p > 0.05.