Figures & data
Table 1. Baseline demographic and clinical characteristics, admission diagnosis and treatment-related variables in critically ill patients with COVID-19 and without COVID-19 (NON-COVID-19).
Figure 1. Sex hormone levels in COVID-19 patients, non-COVID-19 patients, patients with coronary heart diseases and healthy individuals. Estradiol (a,c) and testosterone (b,d) levels were measured in plasma obtained from critically ill COVID-19 patients (ICUCOVID-19), critically ill non-COVID-19 patients (ICUnon-COVID-19), patients with coronary heart diseases (CHD) and healthy individuals (HC). Male data sets are shown in blue color-toned columns and female data sets are shown in red color-toned columns. The laboratory assessed hormone reference ranges are indicated in grey. Percentile boxplots represent 25–75% of values, with the median value indicated by a crossline, and mean values by a plus icon. Statistical significance was assessed via one-way-ANOVA.
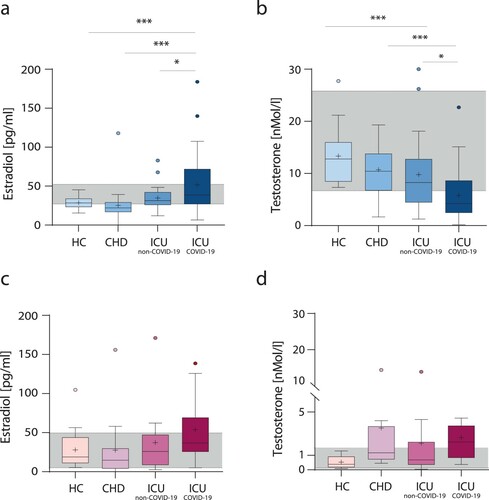
Table 2. Hormone levels in critically ill patients with COVID-19.
Figure 2. Estradiol levels in dependency of disease severity. Estradiol levels measured in plasma obtained from critically ill male (blue columns) and female (red columns) COVID-19 or non-COVID-19 patients are displayed in dependency of disease severity as assessed by SOFA scores (a–c). Male COVID-19 patients were subdivided into patients requiring ECMO therapy (+ECMO) and patients not requiring ECMO therapy (-ECMO) (d). Percentile boxplots represent 25–75% of values, with the median value indicated by a crossline, and mean values by a plus icon. The laboratory assessed hormone reference ranges are indicated in grey. Values are shown as median and interquartile ranges. Statistical significance in males was assessed by NON-parametric tests (Kruskal–Wallis test and Dunn’s test for multiple comparisons). Statistical significance in females was evaluated by unpaired, two-tailed NON-parametric Student’s t-test (Mann–Whitney test).
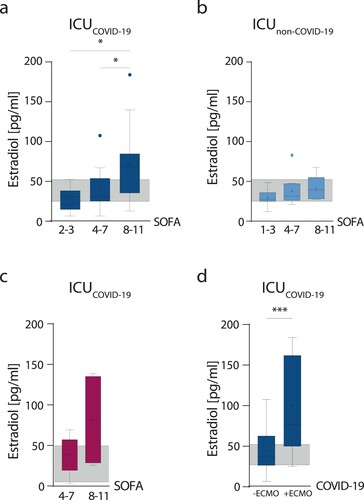
Figure 3. Chemokine and cytokine responses in COVID-19 patients. Cytokine and chemokines were measured in plasma obtained from critically ill male (a–e) and female (f and g) COVID-19 patients using a 27-plex immunoassay. Those with significant differences are shown. Cytokine and chemokine levels of male and female COVID-19 patients are displayed in dependency of disease severity as assessed by SOFA scores (2–3; 4–7; 8–11).
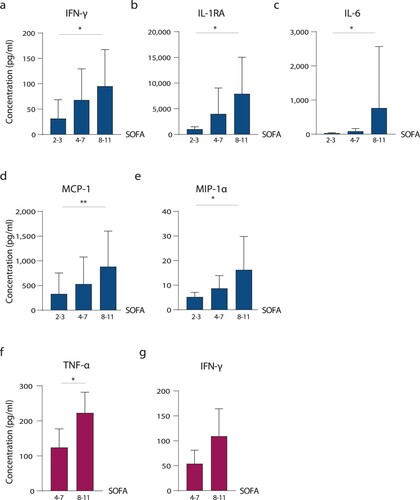
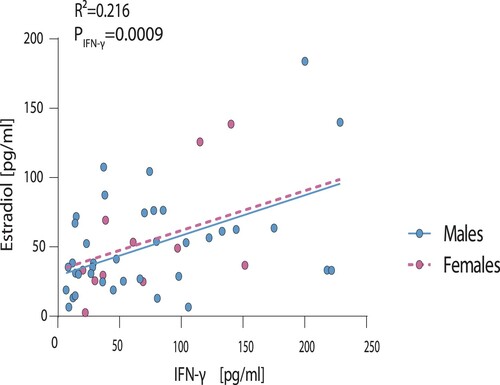
Figure 4. Correlation of IFN-γ levels in male and female COVID-19 patients to estradiol levels. Estradiol levels measured in plasma of critically ill male and female COVID-19 patients were plotted against the expression levels of all cytokines and chemokines assessed. Here, only IFN-γ is displayed, which showed a significant correlation to estradiol levels. Statistical significance was assessed by generalized linear regression.