
Figures & data
Figure 1. CoviVac vaccine production process and identity testing: (A) Principal structure of the vaccine production process. (B) TEM of the negatively stained inactivated vaccine concentrate after chromatographic purification; representative particle (bottom right). (C) SDS-PAGE of the vaccine preparation (purified inactivated virus preparation after chromatography), stained with Coomassie blue. (D) Western blot of the virus preparation before inactivation and vaccine preparation (purified inactivated virus preparation after chromatography), stained with COVID-19 convalescent human serum. (E) Western blot of the virus preparation before inactivation and vaccine preparation (purified inactivated virus preparation after chromatography), stained with anti-S protein rabbit serum. (F) Vero cells infected with SARS-CoV-2 and stained with serum of a CoviVac-immunized mouse (green) and Hoechst 33342 (blue). (G) Vero cells infected with SARS-CoV-2 and stained with COVID-19 convalescent human serum (green) and Hoechst 33342 (blue)
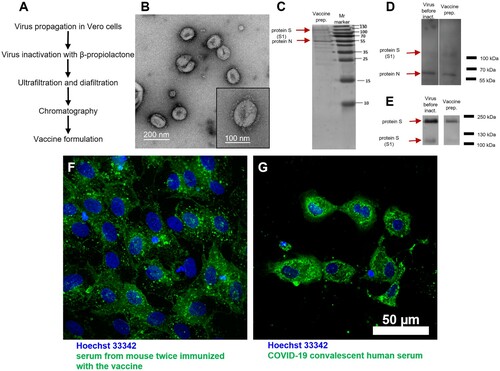
Figure 2. Neutralizing antibody titers against SARS-CoV-2 in BALB/c mice (N = 20, blood was collected from 10 animals at each time point), Syrian hamsters (N = 15) and marmosets (N = 6) vaccinated with CoviVac (lot InCV-05, 6 μg/dose, twice with a 14-day interval). Line shows Mean, whiskers show ± SD. *Differences are statistically significant (Mann–Whitney test, p < 0.05).
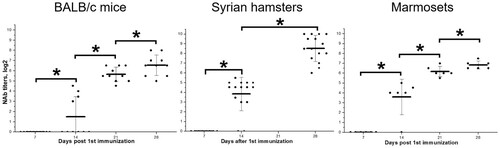
Figure 3. Immune response in BALB/c mice (N = 20/group, blood was collected from 10 animals/group on each time point) immunized with three doses of the vaccine CoviVac (1.5, 3, and 6 μg per dose, twice with 14-day interval). Samples were collected and investigated on days 7, 14, 21 and 28 post 1st immunization. (A) Neutralizing antibody titers in mice of each group. Line shows Mean, whiskers show ± SD. (B) Antibody response against SARS-CoV-2 proteins (N, S and RBD) in ELISA. Serum samples from each group were studied in pools. (C) Splenocyte proliferation assay (6 μg per dose, twice with a 14-day interval). [SARS-CoV-2 - inactivated SARS-CoV-2 (0.5 μg/well); CHIKV - inactivated Chikungunya virus (0.5 μg/well); ConA - Concanavalin A (0.5 μg/well), LPS - lipopolysaccharide of S. typhimurium (0.5 μg/well)] *Stimulation index differences from day 0 are significant (t-test, p < 0.001)
![Figure 3. Immune response in BALB/c mice (N = 20/group, blood was collected from 10 animals/group on each time point) immunized with three doses of the vaccine CoviVac (1.5, 3, and 6 μg per dose, twice with 14-day interval). Samples were collected and investigated on days 7, 14, 21 and 28 post 1st immunization. (A) Neutralizing antibody titers in mice of each group. Line shows Mean, whiskers show ± SD. (B) Antibody response against SARS-CoV-2 proteins (N, S and RBD) in ELISA. Serum samples from each group were studied in pools. (C) Splenocyte proliferation assay (6 μg per dose, twice with a 14-day interval). [SARS-CoV-2 - inactivated SARS-CoV-2 (0.5 μg/well); CHIKV - inactivated Chikungunya virus (0.5 μg/well); ConA - Concanavalin A (0.5 μg/well), LPS - lipopolysaccharide of S. typhimurium (0.5 μg/well)] *Stimulation index differences from day 0 are significant (t-test, p < 0.001)](/cms/asset/042a4d83-86d3-4eaa-a5ef-f863eca4312f/temi_a_1971569_f0003_oc.jpg)
Figure 4. Protective efficacy in Syrian hamsters (N = 15, 5 animals were euthanized on days 4, 7 and 14 p.i.) of the CoviVac vaccine (6 μg per dose, 2 immunizations with a 14-day interval) against intranasal challenge 14 days after the 2nd immunization with 105 TCID50 of SARS-CoV-2 strain PIK35. (A) Scheme of the experiment (visualized by BioRender). (B) Body weights of intact hamsters and challenged vaccinated and control groups. *Differences between intact and vaccinated groups are statistically significant (Mann–Whitney, p<0.05) **Differences between vaccinated and control groups are statistically significant (Mann–Whitney, p < 0.05). (C) Viral RNA presence in nasal swabs of challenged vaccinated and control hamsters on days 1–14 post infection. Line shows Mean, whiskers show ± SD. *Differences between control and vaccinated groups are statistically significant (Mann–Whitney test, p < 0.05). (D) Viral RNA presence in rectal swabs of challenged vaccinated and control hamsters on days 1–14 post infection. Line shows Mean, whiskers show ± SD. *Differences between control and vaccinated groups are statistically significant (Mann–Whitney test, p < 0.05). (E) Viral RNA presence in lungs of challenged vaccinated and control hamsters, collected on days 4, 7 and 14 post infection. Line shows Mean, whiskers show ± SD. *Differences between control and vaccinated groups are statistically significant (Mann–Whitney test, p < 0.05). (F) Viral RNA presence in visceral organs of challenged vaccinated and control hamsters, collected on days 4, 7 and 14 post infection. Numbers signify the number of positive RNA detections per total number of euthanized animals.
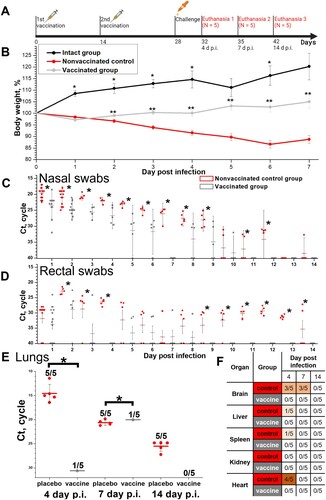
Figure 5. Histopathological findings in non-vaccinated control and vaccinated (6 μg per dose, 2 immunizations with a 14-day interval) Syrian hamsters (N = 15 per group, 5 animals were euthanized on days 4, 7 and 14 p.i.) intranasally challenged 14 days after the 2nd immunization with 105 TCID50 of SARS-CoV-2 strain PIK35. Representative pathological findings in the lungs of infected hamsters on days 4, 7 and 14 p.i. Haematoxylin and eosin.
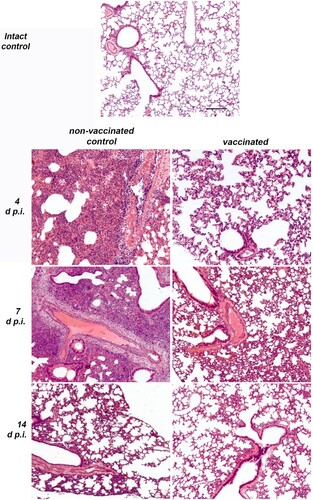
Figure 6. Durability of neutralizing antibody response in BALB/c mice (N = 20, 10 animals/group on each time point) and marmosets (N = 6 for 6 µg and N = 1 for 3 µg) vaccinated with CoviVac (1.5, 3, and 6 μg per dose, 0.5 ml, twice with a 14-day interval) over one year (52 weeks) of observation. *Differences in NAb titers are statistically significant between mice, immunized with 1.5 and 6 μg per dose (Mann–Whitney test, p < 0.05).
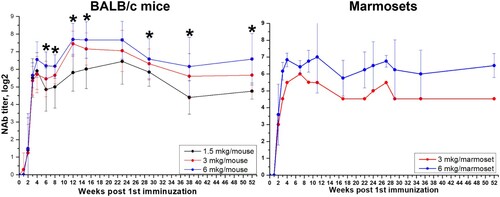
Figure 7 . Immunogenicity of different CoviVac vaccine lots in BALB/c mice (immunized twice with a 14-day interval, nABs were determined 2–8 weeks after the 1st immunization). Line shows mean, whiskers show ± SD. * Differences are statistically significant (Mann–Whitney test, p < 0.05).
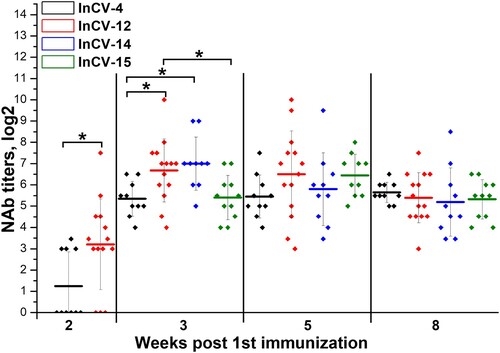
Table 1. Inactivated vaccines against COVID-19 approved for use.