Figures & data
Figure 1. Workflow for comparative proteomics analysis based on stable isotope dimethyl-labelling. Streptomycin-pretreated mice were infected with WT S. Typhimurium SL1344 or ΔssaV MT at 2 and 5 dpi. PBS-treated mice under the same conditions were used as controls. Protein samples from mouse liver and spleen in PBS, WT and ΔssaV-infected groups were extracted, digested, labelled, and mixed in a 1:1:1 ratio for LC-MS/MS analysis and subsequent data analysis.
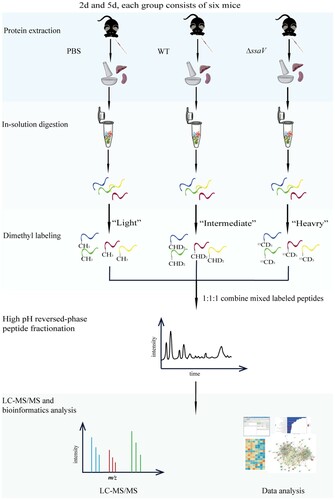
Figure 2. Bacterial loads in the organs of WT S. Typhimurium or ΔssaV MT-infected mice were counted at 2 and 5 dpi: cecum contents (A), liver (B), spleen (C) and mesenteric lymph nodes (D). *, P < 0.05; **, P < 0.01, Mann-Whitney U-test.
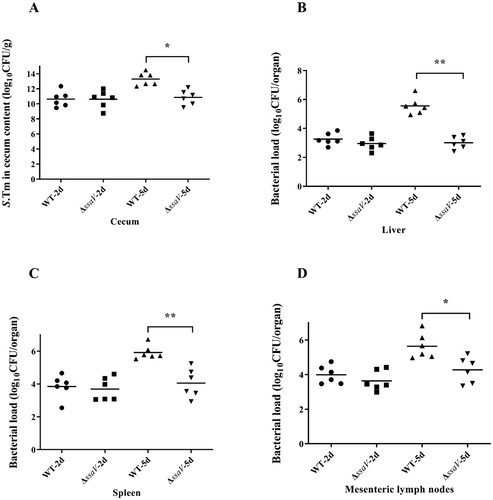
Figure 3. Hematoxylin and Eosin (H&E) stained histopathological sections of liver and spleen of WT S. Typhimurium or ΔssaV MT-infected mice at 2 and 5 dpi (HE, ×100; Bar: 50 μm). Black arrows indicated infiltration of inflammatory cells.
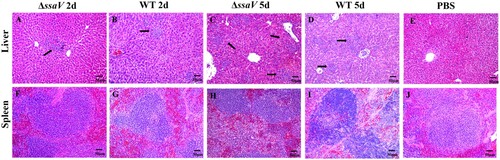
Figure 4. Protein profiles in the liver and spleen of S. Typhimurium-infected mice and alterations across early and late stages of systemic infection. “WTxd/ΔssaVxd” refers to the mixture of WT-infected samples and ΔssaV MT-infected samples at a 1:1 ratio at x days post-infection. Each circle represents the number of proteins identified or quantified in the mixed samples in one biological replicate. (A), Venn diagrams showing the number of proteins identified in each group of samples. (B), Venn diagrams showing the number of proteins that were quantified in each group of samples. (C), Volcano plots showing pairwise comparisons of protein expression levels between WT and ΔssaV groups in mice liver or spleen at different stages of systemic infection. Points above horizontal dashed lines represent significantly altered proteins (two-sided t test, P < 0.05, P values were adjusted by Benjamini–Hochberg correction for multiple comparisons). Significantly up-regulated proteins are shown in red (protein fold change > 1.5) and down-regulated ones are shown in blue (protein fold change < 0.67). (D), Heatmap analysis of the identified proteins from each condition. Rows in heatmap denotes quantified proteins, and column denotes sample. Red colour denotes highly expressed protein, whereas blue denotes lowly expressed protein.
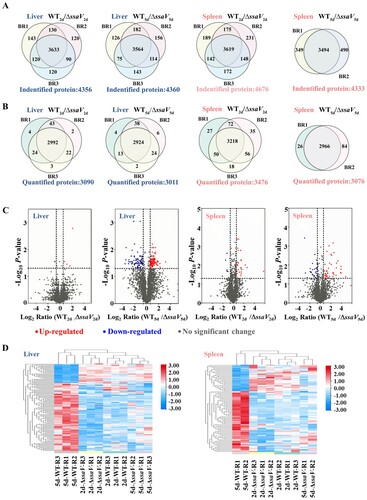
Figure 5. GO and KEGG analysis of the DEPs between WT and ΔssaV groups: GO biological process analysis of the DEPs up-regulated (A) and down-regulated (B) in mice liver or spleen at 5 dpi. (C), KEGG analysis of the DEPs between WT and ΔssaV in mice liver or spleen at 5 dpi.
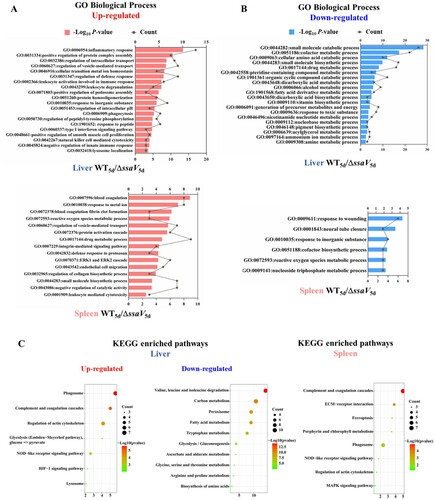
Figure 6. Protein-protein interaction network of DEPs identified from mice liver and spleen at 5 dpi infected with WT S. Typhimurium or ΔssaV mutant.
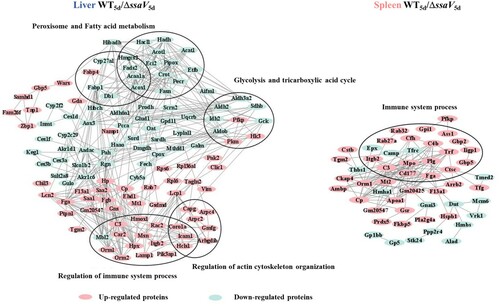
Figure 7. Western blot analysis of CHIL3, CTSC and NAMPT in mice liver and spleen after S. Typhimurium infection.
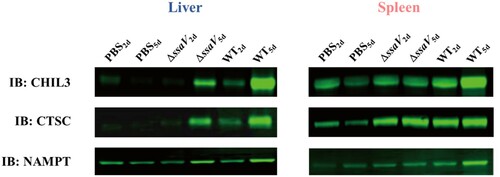
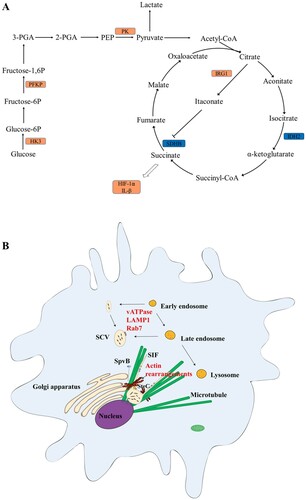
Figure 8. Host responses triggered by S. Typhimurium SPI-2 effectors during systemic infections. (A), SPI-2 effectors may triger host cell metabolic reprogramming and inflammation. WT-Infected cells produce ATP through aerobic glycolysis, rather than relying primarily on oxidative phosphorylation. The TCA cycle was repressed and led to increased accumulation of TCA intermediates itaconate and succinate. (B), Proteins associated with actin polymerization/depolymerization were up-regulated in WT-infected cells comparing to that of the ΔssaV MT-infected cells.