Figures & data
Table 1. Characteristics of study participants.
Figure 1. (Left) Maximum-likelihood phylogenetic trees of HIV-1 pol sequences from 6213 individuals (A). Red and blue lines represent study individuals of 07BC_N and 07BC_O respectively. (Middle) Distribution of individuals in two clusters among different populations. The proportion of individuals in 07BC_N among different transmission risk populations (B1), marital status populations (C1), and residential populations (D1). The proportion of individuals in 07BC_O among different transmission risk populations (B2), marital status populations (C2), residential populations (D2). (Right) Cumulative CRF07_BC transmission network from 1997 to 2008 (E1, E2), 2010 (F1, F2), 2014 (G1, G2) and 2017 (H1, H2). One node represents a sequence or an individual. An edge (link) represents the genetic distance (TN93) between connected sequences ≤ 0·007 substitutions/site. Only nodes connected with others within the network are shown. Edge lengths are optimized for visual presentation and do not represent genetic distance. The colour indicates transmission route. Square indicates 07BC_N on the left side of the image (E1, F1, G1, H1) and the circle indicates 07BC_O on the right (E2, F2, G2, H2). MSM: men who have sex with men; PWID, individuals who use injection drugs.
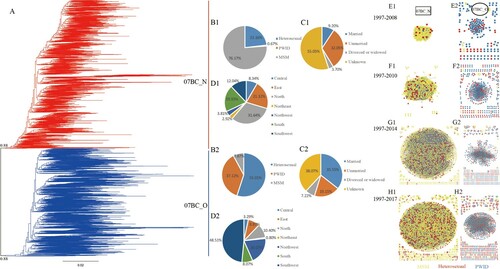
Figure 2. The number of individuals, links, links/individuals and the largest cluster in cumulative transmission networks (CTNs). The number of individuals (A), links (B), links/individuals (C) and the largest cluster (D) in CTNs marks on the y-axis and the sampling year is shown on the x-axis. Blue denotes 07BC_O and orange represents 07BC_N.
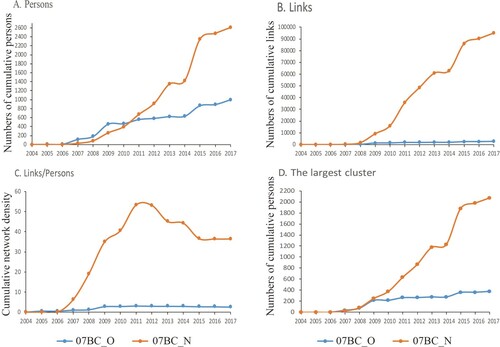
Figure 3. Trends of transmission risk parameter (TR) between two clusters. Each network was divided into three population groups according to quartiles degree. Low-level (two quartiles of the population): individuals linked to 0 other individuals. Medium-level (one quartile of the population): individuals linked to 1–5 other individuals. High-level (one quartile of the population): individuals linked to ≥6 other individuals. The sum of the degree of nodes for each cluster was calculated as the parameter of population transmission risk for medium-level and high-level, and the number of individuals as parameter of population transmission risk for low-level. The percentage of TR within two clusters marks on the y-axis and the sampling year is shown on x-axis. Colours correspond to clusters.
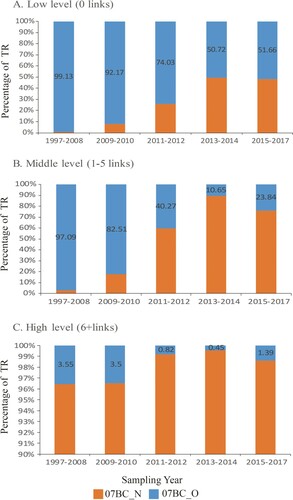
Figure 4. Power-law plot fitted from degree distribution between 07BC_N and 07BC_O in CRF07_BC networks. The graphs show the fitted distribution of degree among 07BC_N (blue) and 07BC_O (orange) in each CRF07_BC network. The fitted power-law function of the form y = cx-r is shown. Besides, the intersection coordinates of two functions from 07BC_N (orange) and 07BC_O (blue) are shown.
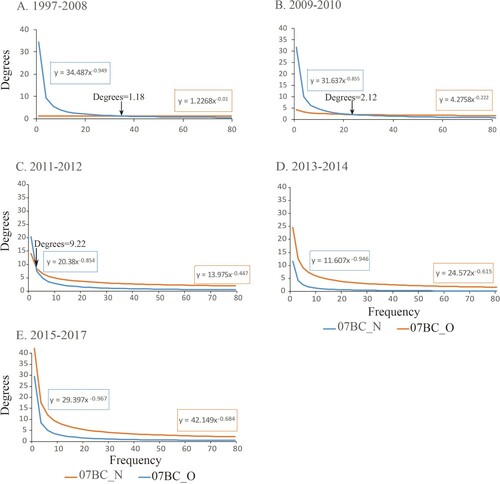
Figure 5. Bayesian skyline plot was estimated to reconstruct the demographic history of the two CRF07_BC clusters in China. The x-axis is the time in units of years and the y-axis is equal to the effective population size. The solid line and shaded region represent the median and 95% credibility interval of the effective population size through time. The demographic histories of the 07BC_O (blue) and 07BC_N (red) epidemics, as estimated by the Bayesian skygrid model, are based on subsets of 645 and 993 pol sequences respectively. While it appears that the epidemic among 07BC_O sequences reached its peak in the mid-2000s and is slowing down, all evidence points toward the 07BC_N epidemic still growing.
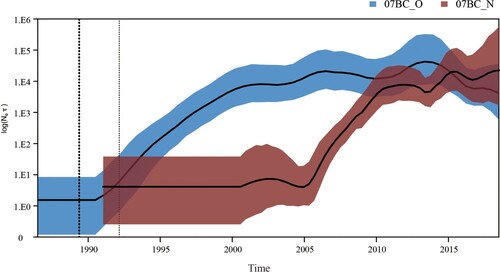
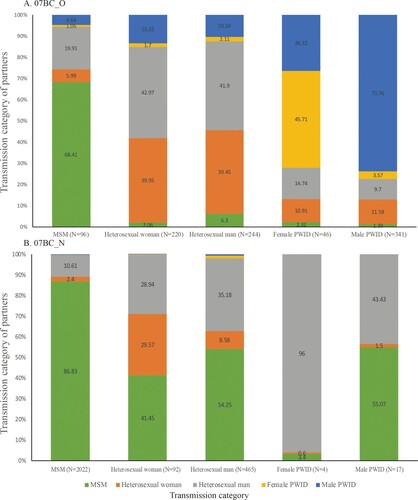
Figure 6. Transmission category of potential transmission partners. This figure shows, for individuals in the transmission network of a given transmission category for 07BC_O (A) and 07BC_N (B), the transmission category of their potential transmission partners. MSM: men who have sex with men; PWID: persons who inject drugs.