Figures & data
Figure 1. PRISMA flow diagram of the article screening process for a systematic review of influenza genotype to phenotype prediction studies employing a machine learning approach. There were 449 articles captured from 3 PubMed database searches; 28 articles were identified through tracing the references in and articles citing the full-text reviewed articles. A total of 49 articles were included in the final review.
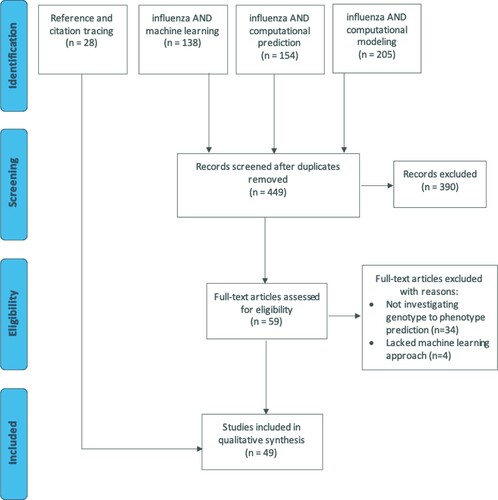
Figure 2. Studies employing machine learning techniques to generate influenza genotype to phenotype predictions. Studies are shown over (a) time and (b) categorization. Generated with MATLAB R2020b (The MathWorks, Inc., Natick, MA).
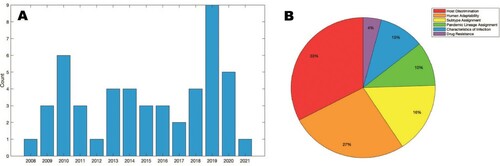
Figure 3. Common pipeline for training and testing machine learning classifiers to generate influenza genotype to phenotype predictions. (Data Preprocessing) sequence data is converted into a usable feature set and labelled. (Dimensionality Reduction) optionally, high dimensional data is distilled either through feature selection, in which features with low correlation or low importance for determining classification are removed, or through feature extraction, in which features are transformed into a lower dimensional plane. (Model Training) the machine learning classifier is trained using a K-fold cross-validation or leave-one-out analysis, in which different subsets of the data are used for training and testing the model. The average performance metrics for the training and testing folds are compared to strike a balance between overfitting and accurate model performance. (Performance Evaluation) the model is tested against an independent testing dataset with known labels. Performance metrics are produced, and, in some cases, the importance of specific features may be evaluated.
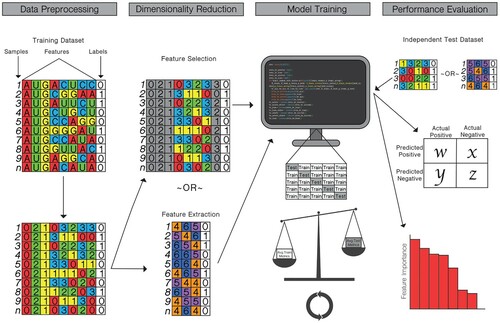
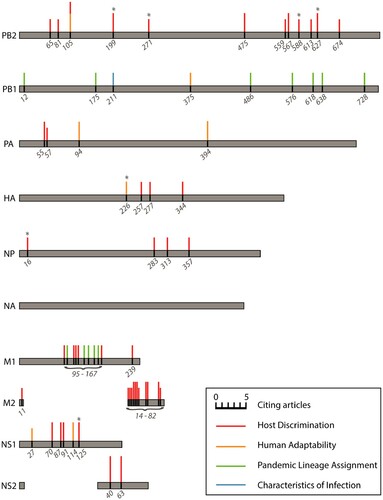
Figure 4. Influenza A virus amino acid positions identified as important for generating predictions of host discrimination, human adaptability, pandemic lineage assignment, or characteristics of infection among two or more of the reviewed machine learning studies from independent labs. The size of the coloured bars is proportional to the number of references citing that position as an important feature in their model. No important features in neuraminidase (NA) were identified in more than one study. Asterisks denote positions with an empirically demonstrated function; see Table S3 for descriptions and references.