Figures & data
Figure 1. Construction of ΔE3-HAdV4 and ΔE3-HAdV7. Diagrams of construction of ΔE3-HAdV4 (A) and ΔE3-HAdV7 (B) from wild type adenovirus. LITR, left inverted terminal repeat; RITR, right inverted terminal repeat. (C and D) are western blot assay results. Total protein extracts of HEK293 cells infected with Wt-HAdV4, Wt-HAdV7, ΔE3-HAdV4 and ΔE3-HAdV7 in gradient concentration were analyzed by western blot under non-reducing condition using anti-HAdV4 hexon antibody (C) and anti-HAdV7 hexon antibody (D), respectively.
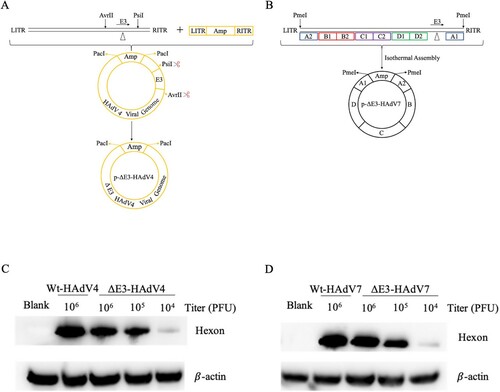
Figure 2. Characterization of ΔE3-HAdV4 and ΔE3-HAdV7. (A) Comparation of replication capacity between Wt-HAdV4 and ΔE3-HAdV4. Wt-HAdV4 vs. ΔE3-HAdV4, ***, P = 0.0002. (B) Comparation of replication capacity between Wt-HAdV7 and ΔE3-HAdV7. Wt-HAdV7 vs. ΔE3-HAdV7, ****, P < 0.0001. (C) Comparation of cell viability after Wt-HAdV4 and ΔE3-HAdV4 infection. Wt-HAdV4 vs. ΔE3-HAdV4 at 1moi, ***, P = 0.0001; at 0.3 moi, ****, P < 0.0001; at 0.1 moi, ***, P = 0.0002. (D) Comparation of cell viability after Wt-HAdV7 and ΔE3-HAdV7 infection. Wt-HAdV7 vs. ΔE3-HAdV7 at 1 moi, ****, P < 0.0001; at 0.3 moi, ****, P < 0.0001; at 0.1 moi, ****, P < 0.0001. (E) Comparation of PFU between Wt-HAdV4 and ΔE3-HAdV4. Wt-HAdV4 vs. ΔE3-HAdV4, **, P = 0.0014. (F) Comparation of PFU between Wt-HAdV7 and ΔE3-HAdV7. Wt-HAdV7 vs. ΔE3-HAdV7, ****, P < 0. 0001. Two-way ANOVA was applied to compare the differences between groups. All data are presented as the means ± SEM. Each experiment was repeated three times. ns, no significance; *, P < 0.05; **, P < 0.01; ***, P < 0.001; ****, P < 0.0001.
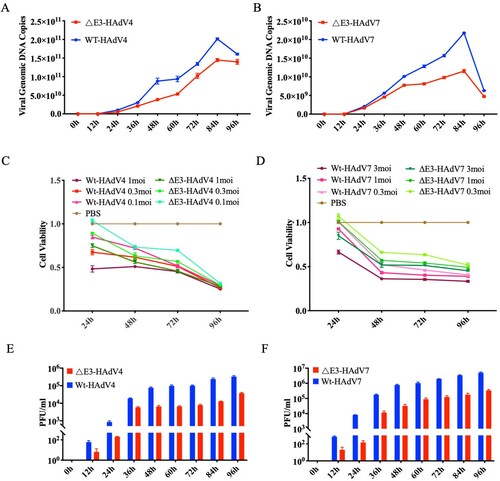
Figure 3. Assessment of antibody responds in BALB/c mice. Animals were immunized with ΔE3-HAdV4, ΔE3-HAdV7 or mixture of the two components for single administration, intramuscularly. Sera of mice were collected at 2 and 4 weeks after vaccination. (A) Binding antibody endpoint titres against Wt-HAdV4. (B) Binding antibody endpoint titres against Wt-HAdV7. (C) Neutralizing antibody titres against Wt-HAdV4. (C) Neutralizing antibody titres against Wt-HAdV7. Each line represents the average titre. One-way ANOVA was applied to compare the differences between groups. All data are presented as the means ± SEM. ns, no significance; *, P < 0.05; **, P < 0.01; ***, P < 0.001; ****, P < 0.0001.
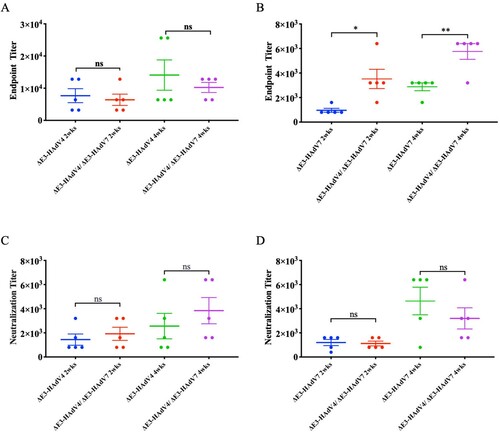
Figure 4. Cross antibody reaction. Sera from monovalent vaccine groups were manipulated for cross antibody reaction. (A) Wt-HAdV4 and ΔE3-HAdV7 in gradient concentration were analyzed by western blot under non-reducing condition using anti-HAdV4 sera from immunized mice. (B) Wt-HAdV7 and ΔE3-HAdV4 in gradient concentration were analyzed by western blot under non-reducing condition using anti-HAdV7 sera from immunized mice. (C) Binding antibody endpoint titres of ΔE3-HAdV4 immunized serum against Wt-HAdV7. (B) Binding antibody endpoint titres of ΔE3-HAdV7 immunized serum against Wt-HAdV4. (C) Neutralizing antibody titres of ΔE3-HAdV4 immunized serum against Wt-HAdV7. (C) Neutralizing antibody titres of ΔE3-HAdV7 immunized serum against Wt-HAdV4. Each spot represents an individual animal. One-way ANOVA was applied to compare the differences between groups. ns, no significance; *, P < 0.05; **, P < 0.01; ***, P < 0.001; ****, P < 0.0001.
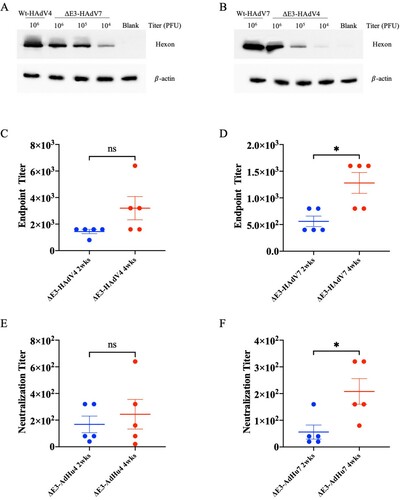
Figure 5. Protection against wild-type adenovirus challenge in vaccinated mice. 4 weeks after vaccination, mice were challenged. qPCR was used to determine the viral genome copies per 50 mg lung tissues on days 3 and 5 post challenge respectively. (A) Viral loads in lung tissues challenged by Wt-HAdV4; (B) Viral loads in lung tissues challenged by Wt-HAdV7. Each spot represents an individual animal. One-way ANOVA was applied to compare the differences between groups. ns, no significance; *, P < 0.05; **, P < 0.01; ***, P < 0.001; ****, P < 0.0001.
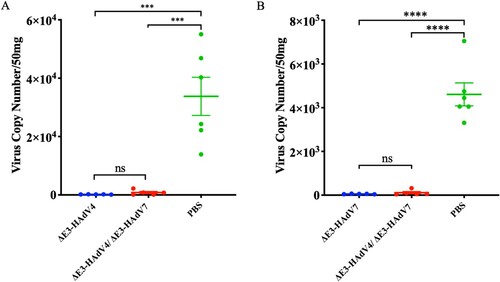
Figure 6. Histopathological observation and histological score of lung tissues from infected mice. Lung sections derived from mice infected with Wt-HAdV4(A) or Wt-HAdV7(B) were stained by H&E 3 and 5 days after challenge, respectively. (C) Scoring for histological changes in lungs of infected mice. Each symbol represents one mouse, and the line indicates the mean value of the group.
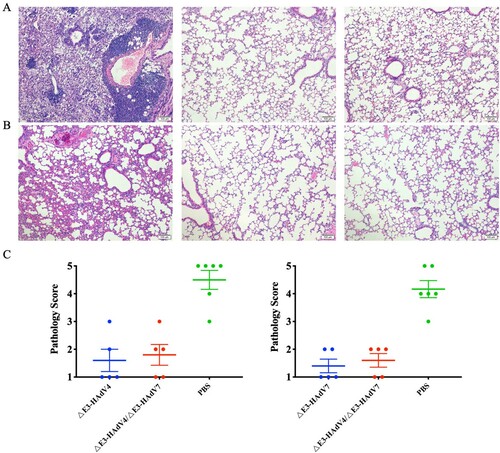
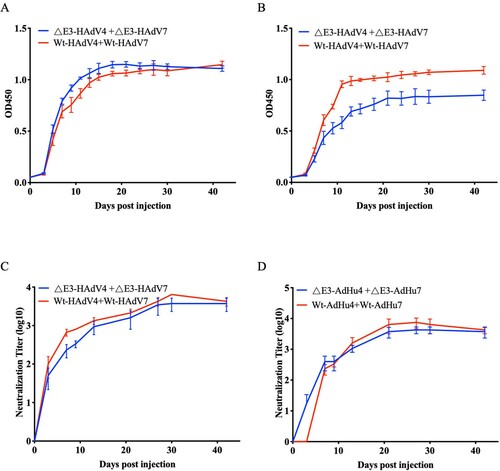
Figure 7. Comparation of antibody responds between E3-deleted and wild-type Ads. Mice immunized with virus of ΔE3-HAdV4 + ΔE3-HAdV7 and Wt-HAdV4 + Wt-HAdV7 were blooded constantly till 42 days. (A) Binding antibody titres against Wt-HAdV4. ΔE3-HAdV4 + ΔE3-HAdV7 vs. Wt-HAdV4 + Wt-HAdV7, ns, P = 0.1655. (B) Binding antibody titres against Wt-HAdV7. ΔE3-HAdV4 + ΔE3-HAdV7 vs. Wt-HAdV4 + Wt-HAdV7, **, P = 0.0081. Data are shown as mean absorbance among the same group (n=5). (C) Neutralizing antibody titres against Wt-HAdV4. ΔE3-HAdV4 + ΔE3-HAdV7 vs. Wt-HAdV4 + Wt-HAdV7, ns, P = 0.3620. (D) Neutralizing antibody titres against Wt-HAdV7. ΔE3-HAdV4 + ΔE3-HAdV7 vs. Wt-HAdV4 + Wt-HAdV7, ns, P = 0.4908. Data are shown as mean NATs among the same group (n = 5). Two-way ANOVA was applied to compare the differences between groups. ns, no significance; *, P < 0.05; **, P < 0.01; ***, P < 0.001; ****, P < 0.0001.