Figures & data
Table 1. Characteristics of the strains used in this study.
Table 2. Minimum inhibitory concentration (MIC) of various antibiotics for strains before and after induction.
Table 3. Resistance to CAZ-AVI increased in a stepwise manner following passage with CAZ-AVI.
Table 4. Mutations identified in KPCs, LamB and PBP3 and expression level of blaKPC during induction.
Table 5. Complementation experiment for LamB and PBP3.
Table 6. Complementation experiment of KPCs.
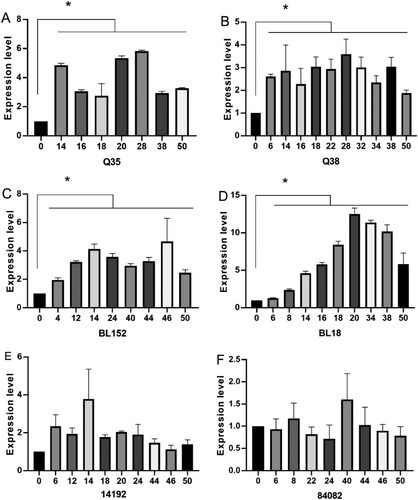
Figure 1. The blaKPC expression levels in strains without mutations in KPC. The horizontal axis is the number of passages of induction. The vertical axis is the relative expression level compared to the strain before induction (expression = 1.0). The housekeeping gene rpoB was used as the endogenous reference gene. All RT-qPCR were carried out in triplicate. *P < 0.05 (Student’s t-tests).